

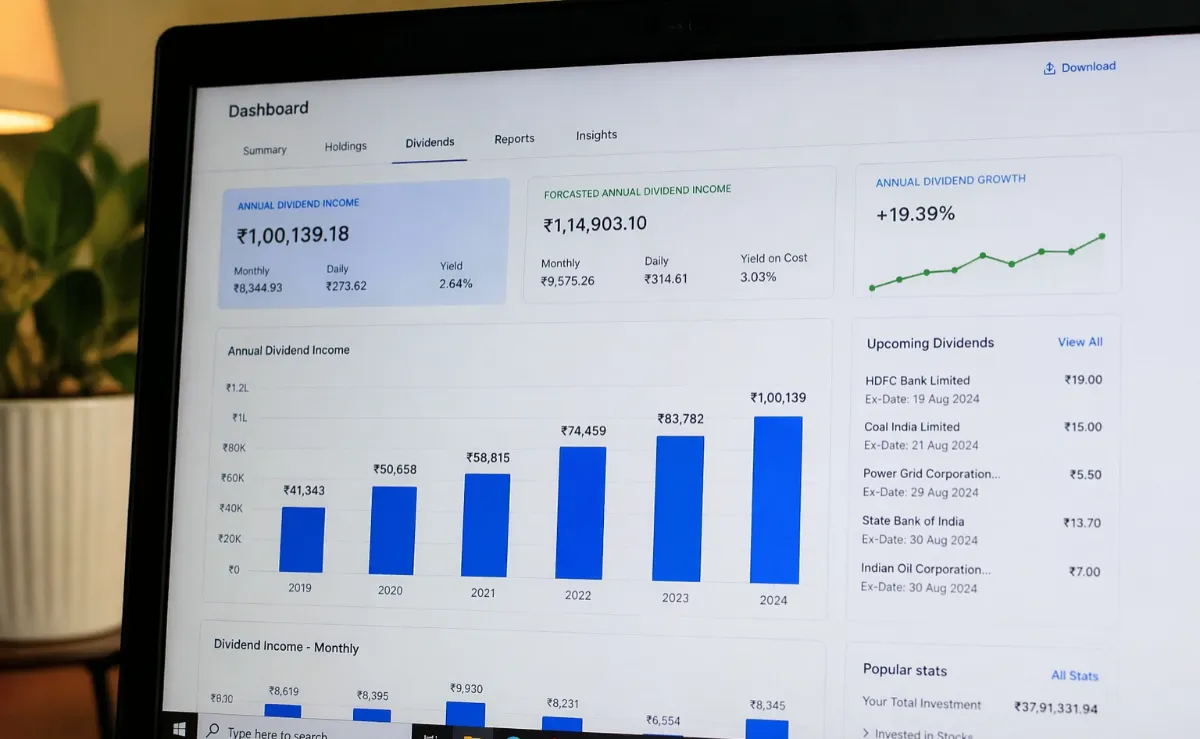
Imagine waking up every month to ₹30,000–₹1 lakh deposited in your bank account — without going to work, without selling any investments. This is the power of a well-built dividend portfolio. Unlike fixed deposits that erode with inflation, or mutual fund SWPs that eat your principal, dividend investing lets your capital work for you while growing simultaneously. This guide shows you exactly how to build it, step by step.

What Is a Dividend Portfolio?
A dividend portfolio is a collection of stocks, REITs (Real Estate Investment Trusts), or other income-generating assets that regularly distribute a portion of their profits to shareholders in the form of dividends. Unlike growth investing — where you profit only by selling shares — dividend investing creates an ongoing cash flow stream from your existing holdings.
In India, dividends are paid by companies like Coal India, ITC, Power Grid, ONGC, and many others — often quarterly, semi-annually, or annually. The goal is to accumulate enough shares that the dividends alone cover your living expenses — creating true financial independence.
Regular Cash Flow
Receive dividend payouts without selling any shares — true passive income.
Capital Appreciation
Quality dividend stocks also grow in value over time, building wealth on two fronts.
Inflation Hedge
Companies that grow dividends annually help your income keep pace with inflation.
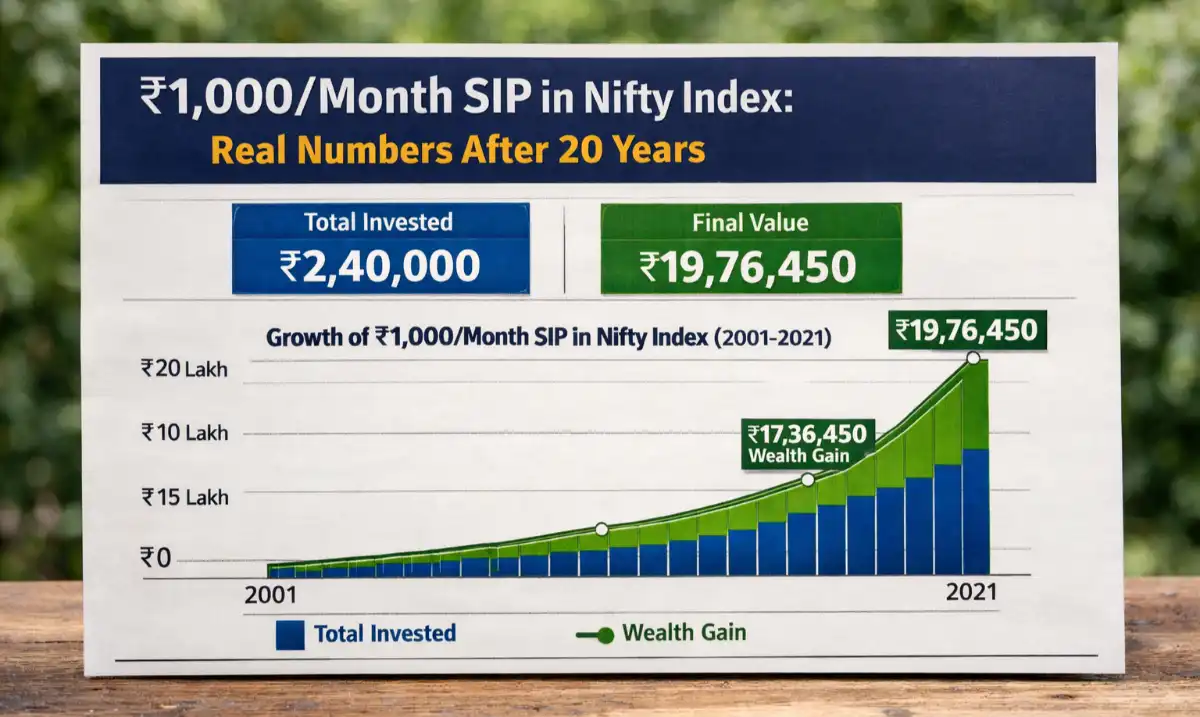
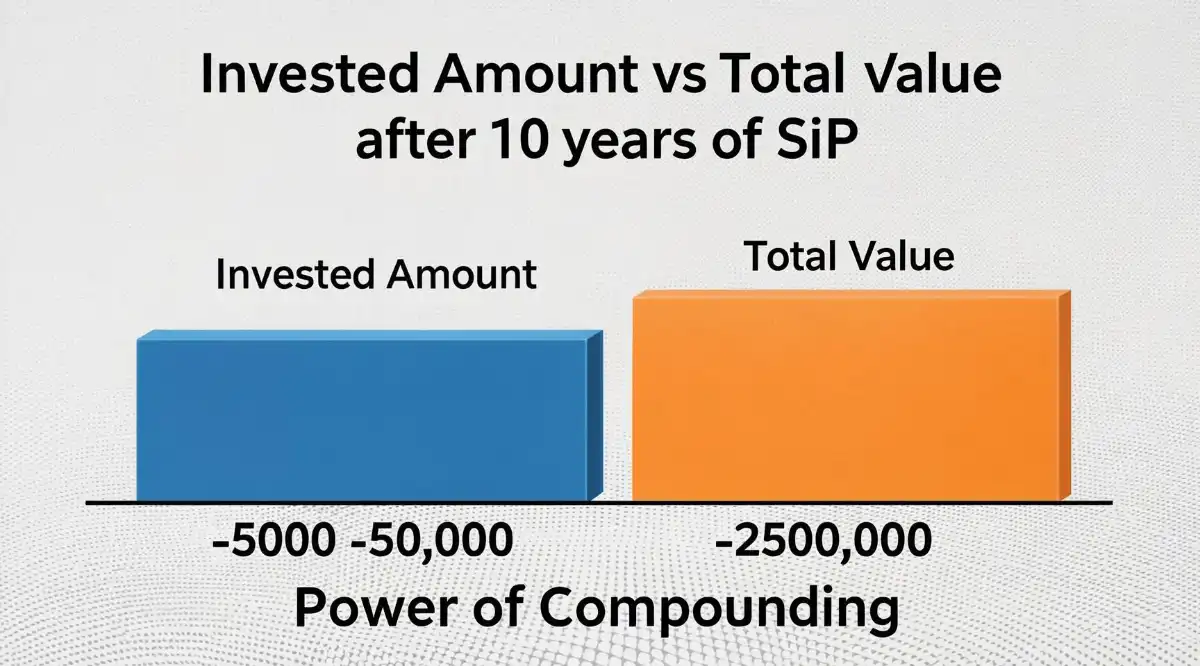
Compounding Power
Reinvesting dividends creates exponential growth through the power of compounding.
Why Dividend Investing Beats FD & SWP
Most Indian investors default to Fixed Deposits or Post Office schemes for passive income. However, dividend investing offers significantly superior long-term outcomes when done correctly.
Comparison: Dividend Portfolio vs FD vs Mutual Fund SWP
| Parameter | Dividend Portfolio | Fixed Deposit | MF SWP |
|---|---|---|---|
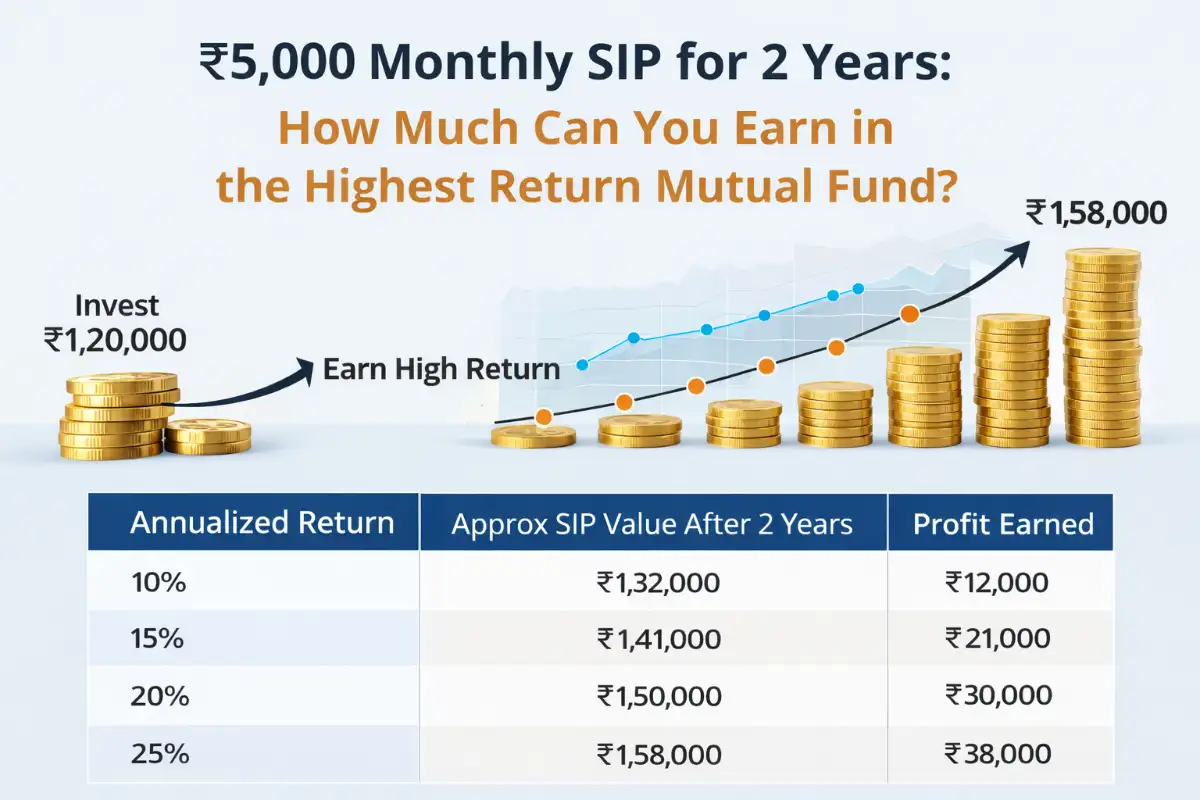
| Average Annual Return | 12–18% (yield + growth) | 6.5–7.5% | 10–12% |
| Principal Safety | Capital grows over time | 100% guaranteed | Principal depletes in SWP |
| Inflation Protection | Strong (rising dividends) | Weak (fixed rate) | Moderate |
| Taxation | As per income slab | As per income slab | LTCG @ 12.5% on gains |
| Liquidity | High (sell anytime) | Penalty on early withdrawal | High |
| Risk Level | Medium | Very Low | Medium |
| Corpus Needed for ₹50K/mo | ~₹75–90 Lakhs | ~₹1 Crore | ~₹70–80 Lakhs |
Step 1: Define Your Income Goal & Corpus Target
The first and most important step is clarity on your target. How much monthly passive income do you need? Work backward from your desired lifestyle to calculate the required portfolio size.
Required Corpus = (Monthly Income Need × 12) ÷ Portfolio Yield %
Example: ₹50,000/month × 12 = ₹6,00,000 annual income ÷ 6.5% yield = ₹92,30,769 corpus required
Corpus Required vs Monthly Income Target (at 5–8% Portfolio Yield)
| Monthly Income Target | Annual Income | At 5% Yield | At 6.5% Yield | At 8% Yield |
|---|---|---|---|---|
| ₹15,000/month | ₹1.8 Lakhs | ₹36 Lakhs | ₹27.7 Lakhs | ₹22.5 Lakhs |
| ₹25,000/month | ₹3 Lakhs | ₹60 Lakhs | ₹46.2 Lakhs | ₹37.5 Lakhs |
| ₹50,000/month | ₹6 Lakhs | ₹1.2 Crore | ₹92 Lakhs | ₹75 Lakhs |
| ₹75,000/month | ₹9 Lakhs | ₹1.8 Crore | ₹1.38 Crore | ₹1.13 Crore |
| ₹1,00,000/month | ₹12 Lakhs | ₹2.4 Crore | ₹1.85 Crore | ₹1.5 Crore |
Pro Tip
Set a slightly higher income target than your current need (by 20–30%) to account for inflation, unexpected expenses, and tax outgo on dividend income. Building a buffer makes the portfolio truly sustainable for life.
Step 2: Understand Dividend Yield & Key Metrics
Before buying any dividend stock, you must understand the core metrics that define dividend quality. A high yield is not automatically good — it can signal a company in distress. Here are the key parameters to evaluate:
Key Dividend Metrics — Definition & Target Range
| Metric | Formula / Definition | Ideal Range | Warning Signal |
|---|---|---|---|
| Dividend Yield | Annual Dividend ÷ Stock Price × 100 | 3.5% – 8% | Above 10% (value trap risk) |
| Payout Ratio | Dividends Paid ÷ Net Profit × 100 | 30% – 70% | Above 80% (unsustainable) |
| Dividend Consistency | No. of years dividend paid without cut | Minimum 5 years | Gaps or cuts in past 3 years |
| Dividend Growth Rate | CAGR of dividend per share over 5 years | 5% – 15% CAGR | Flat or declining dividends |
| Free Cash Flow (FCF) | Operating CF minus Capital Expenditure | FCF > Dividends paid | Dividends funded by debt |
| Debt-to-Equity Ratio | Total Debt ÷ Shareholders’ Equity | Below 1.0 (ideally < 0.5) | D/E above 2 for non-finance |
The Dividend Yield Trap — What To Avoid
A stock yielding 15–20% might seem attractive, but it often signals that the share price has crashed due to business problems, and the company may soon cut or eliminate its dividend. Always prioritize sustainable yield with consistent growth over the highest yield in the market.
Step 3: Screen Quality Dividend Stocks in India (2025)
India has a strong universe of dividend-paying stocks, particularly in PSU (Public Sector Undertaking) companies, FMCG, and infrastructure. Here are the top dividend stocks screened for quality, consistency, and yield:
Top Dividend Stocks India 2025 — Screened for Quality & Yield
| Stock | Sector | Div. Yield | Payout Ratio | 5Y Consistency | Quality |
|---|---|---|---|---|---|
| Coal India Ltd | Energy / PSU | 6.5–8% | 75–80% | ✔ Consistent | High |
| Hindustan Zinc | Metals / Mining | 6–9% | 70–90% | ✔ Consistent | High |
| Power Grid Corp. | Infrastructure / PSU | 4.5–6% | 50–60% | ✔ Consistent | High |
| ONGC | Oil & Gas / PSU | 4–6% | 35–50% | ✔ Consistent | High |
| ITC Limited | FMCG / Diversified | 3.5–5% | 80–90% | ✔ Consistent | High |
| REC Limited | Finance / PSU | 5–7% | 25–35% | ✔ Consistent | High |
| NMDC | Mining / PSU | 4–6% | 40–55% | ✔ Consistent | Medium |
| Vedanta Ltd | Metals / Diversified | 8–15% | High (variable) | ⚠ Inconsistent | Caution |
| NTPC Limited | Power / PSU | 3–4.5% | 30–40% | ✔ Consistent | High |
| Infosys | IT / Technology | 2.5–3.5% | 50–70% | ✔ Consistent | High |
Important Note on Vedanta
Vedanta has historically paid very high dividends (8–15%) but with significant inconsistency and high debt levels. It can be included as a small tactical allocation (max 5–8% of portfolio) but should not form the core of a lifetime income portfolio due to dividend sustainability risk.
Step 4: Sector Diversification Strategy
Never concentrate your dividend portfolio in a single sector. Each sector has different dividend cycles, business risks, and regulatory environments. A diversified portfolio ensures that even if one sector cuts dividends, others continue paying.
Recommended Sector Allocation — Dividend Portfolio India
| Sector | Allocation % | Key Stocks | Avg Yield | Characteristics |
|---|---|---|---|---|
| PSU Energy & Mining | 25–30% | Coal India, ONGC, NMDC | 5–8% | High yield, government backing |
| Infrastructure & Utilities | 20–25% | Power Grid, NTPC, NHPC | 4–6% | Stable, regulated income |
| FMCG & Consumer | 15–20% | ITC, HUL, Colgate | 3–5% | Inflation-resilient, dividend growth |
| Finance & NBFC | 15–20% | REC, PFC, Bajaj Finance | 4–7% | Strong payout, growing earnings |
| IT & Technology | 10–15% | Infosys, TCS, Wipro | 2.5–4% | Lower yield, high growth |
| Metals & Materials | 5–10% | Hindustan Zinc, MOIL | 5–9% | Cyclical, high yield phase |
Step 5: Build the Portfolio — SIP-Style Approach
Building a ₹75–1 crore dividend portfolio doesn’t happen overnight. The smartest approach is to use a systematic stock buying strategy — similar to a mutual fund SIP but applied to individual dividend stocks.
Start with ₹20,000–₹30,000/month in systematic stock purchases
Allocate a fixed amount monthly across 4–5 core stocks from your watchlist. This averages your purchase cost over time (rupee-cost averaging) and reduces the impact of market volatility on your entry price.
Buy more during market corrections (10–20% dips)
Keep 10–15% of your portfolio budget as dry powder — cash reserve — specifically to deploy during market corrections. A 15% dip in Coal India from ₹450 to ₹382 increases your yield from 7% to 8.2% on that purchase.
Build position size over 3–6 months per stock
Do not put the entire allocation in one stock on one day. Buy in 3 tranches over 90–180 days to smooth out entry price. Once a stock reaches target weight (8–12% of portfolio), stop fresh purchases and redirect to underweight positions.
Reach target portfolio in 18–36 months for best results
Rushing to deploy a lump sum into dividend stocks immediately exposes you to concentration risk. A 18–36 month build period gives you multiple dividend cycles to observe actual payout behavior before making it a major position.
Step 6: DRIP Strategy — Compound Your Wealth
In the growth phase (first 5–10 years), do not withdraw dividends. Instead, reinvest every rupee of dividend back into more dividend stocks. This is the Dividend Reinvestment Plan (DRIP) strategy — and it creates exponential growth.
DRIP vs No-DRIP: ₹25 Lakh Portfolio at 6.5% Yield + 8% Capital Growth
| Year | Portfolio Value (DRIP) | Annual Dividend (DRIP) | Portfolio Value (No DRIP) | Annual Dividend (No DRIP) |
|---|---|---|---|---|
| Year 1 | ₹27.0 L | ₹1.76 L | ₹27.0 L | ₹1.63 L |
| Year 3 | ₹34.8 L | ₹2.26 L | ₹31.5 L | ₹2.05 L |
| Year 5 | ₹45.1 L | ₹2.93 L | ₹36.7 L | ₹2.39 L |
| Year 7 | ₹58.3 L | ₹3.79 L | ₹42.8 L | ₹2.78 L |
| Year 10 | ₹84.6 L | ₹5.50 L | ₹53.9 L | ₹3.50 L |
| Year 15 | ₹1.52 Cr | ₹9.88 L/yr | ₹79.2 L | ₹5.15 L/yr |
As the table shows, the DRIP investor with ₹25 lakhs starting corpus reaches ₹1.52 Crore in 15 years — generating ₹9.88 lakhs annually (₹82,300/month) vs only ₹79 lakhs for the non-DRIP investor. That’s a 92% difference in outcome purely from reinvestment discipline.
Two-Phase Strategy
Phase 1 (Accumulation — Year 1 to 10): Reinvest 100% of dividends. Add fresh capital monthly. Focus on growing the corpus as fast as possible.
Phase 2 (Income — Year 11 onwards): Switch to withdrawing dividends for living expenses. Stop DRIP. Enjoy the passive income you’ve built.
Step 7: Tax Planning on Dividend Income
Dividend income in India is taxable, and smart tax planning can save you 10–30% of your dividend receipts. Here’s what every dividend investor in India must know:
Dividend Tax Rules India (FY 2025–26)
| Rule | Detail | Impact |
|---|---|---|
| Taxation Basis | Added to total income, taxed at slab rate | High earners pay 30% tax on dividends |
| TDS Threshold | TDS @ 10% if dividends > ₹5,000 from one company | Refundable via ITR if below slab |
| Form 15G/15H | Submit to company to avoid TDS if income below taxable limit | No TDS deducted |
| Interest Deduction | Interest paid on loan for shares deductible up to 20% of dividend | Reduces tax liability for leveraged investors |
| HUF Structure | Creating a HUF splits income across family members | Can save ₹1–2L in taxes annually |
| ELSS + Dividend Mix | Offset dividend income with Section 80C deductions | Reduces net taxable income |
Tax-Efficient Tip for Retirees
If you are a senior citizen with total annual income below ₹3 lakhs (basic exemption), you pay zero tax on dividend income. This makes dividend portfolios exceptionally tax-efficient for retirees who have no other active income source. Submit Form 15H to avoid TDS at source.
Step 8: Annual Review & Rebalancing
A dividend portfolio is not “set and forget.” Annual reviews ensure you remove dividend cutters, replace underperformers, and maintain target allocations as stock prices fluctuate.
When to Exit a Dividend Stock
There are clear signals that indicate when to reduce or exit a position, even from a long-term holding:
Dividend Cut or Skip
If a company cuts or skips dividend for 2+ consecutive years, exit the position systematically over 2–3 months.
Payout Ratio > 90%
Unsustainably high payout ratios indicate the dividend may be funded by debt or asset sales — not real earnings.
Government Policy Change
For PSU stocks, sudden changes in government dividend policy (especially pre-election) can impact payouts significantly.
Better Yield Opportunity
If a new stock offers significantly better yield/quality, trim an overweight position and redeploy capital.
Sample Dividend Portfolio India ₹75 Lakh Corpus (2025)
Here is a model dividend portfolio built for ₹75 lakh invested corpus targeting ₹4.5–5 lakh annual dividend income (approximately ₹37,500–41,700/month). This is for educational illustration only and not personalized investment advice.
Model Dividend Portfolio — ₹75 Lakh Corpus (Illustrative)
| Stock | Sector | Allocation | Amount | Est. Yield | Annual Income |
|---|---|---|---|---|---|
| Coal India | PSU Energy | 18% | ₹13.5 L | 7% | ₹94,500 |
| Power Grid Corp. | Infrastructure | 15% | ₹11.25 L | 5.5% | ₹61,875 |
| REC Limited | Finance PSU | 12% | ₹9 L | 6% | ₹54,000 |
| ITC Limited | FMCG | 12% | ₹9 L | 4% | ₹36,000 |
| ONGC | Oil & Gas | 10% | ₹7.5 L | 5% | ₹37,500 |
| Hindustan Zinc | Metals | 8% | ₹6 L | 7% | ₹42,000 |
| NTPC | Power PSU | 8% | ₹6 L | 4% | ₹24,000 |
| Infosys | IT | 8% | ₹6 L | 3% | ₹18,000 |
| NMDC | Mining PSU | 5% | ₹3.75 L | 5% | ₹18,750 |
| Cash Reserve | — | 4% | ₹3 L | — | — |
| TOTAL | 9 Sectors | 100% | ₹75 Lakhs | ~5.2% | ₹3,86,625 |
This portfolio generates approximately ₹3.87 lakhs annually (~₹32,200/month) at estimated current yields. With 6–8% annual dividend growth over 5 years, the same portfolio is projected to generate ₹5.5–6 lakhs per year without adding any fresh capital.
Start Building Your Dividend Machine Today
A dividend portfolio is not a get-rich-quick scheme — it is a long-term wealth-building system that rewards patience, discipline, and consistent execution. The investor who starts today with ₹20,000/month, reinvests all dividends, and stays invested for 15 years will likely achieve true financial independence.
The best time to start was 10 years ago. The second best time is now.


1 thought on “Build a Dividend Portfolio for Lifetime Passive Income”