
Introduction
Earning ₹1,00,000 every month without actively working is no longer a fantasy reserved for the ultra-wealthy. In 2026, India’s maturing capital markets, rising corporate payouts, and expanding REIT ecosystem make this milestone achievable for disciplined investors.
Breaking it down: ₹1,00,000 per month equals ₹3,333 per day or ₹12,00,000 annually. At a blended portfolio yield of 6.8%–8%, you need an invested corpus of approximately ₹1.5 crore to ₹1.75 crore. That is the math this article proves — with real data.
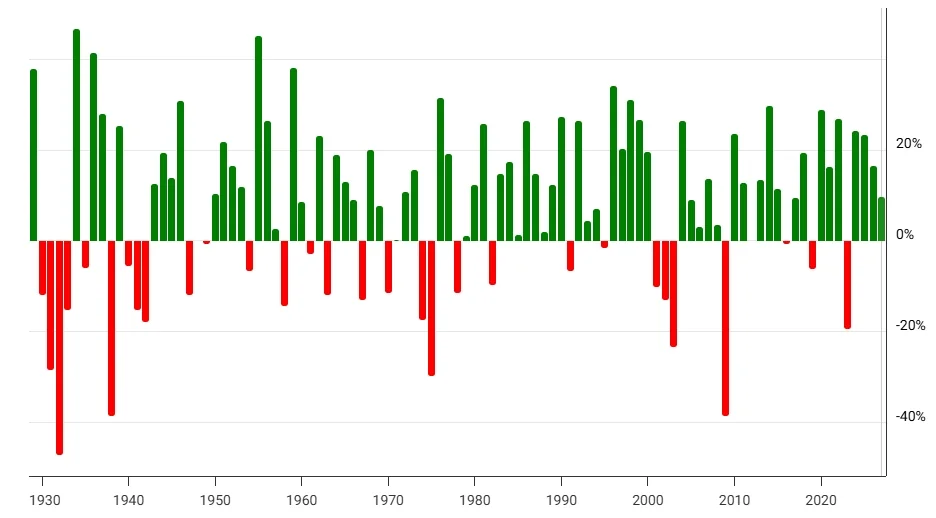
Key Insight: India’s NSE-listed companies paid out ₹3.2 lakh crore in dividends in FY2025–26, growing at 14.6% YoY. Dividend culture in India is accelerating, not slowing.
Market Overview
India’s dividend market has entered a structural growth phase. PSU companies alone distributed ₹87,000 crore+ in dividends in FY2026, up from ₹63,000 crore in FY2024. The Nifty 50 dividend yield stands at 1.6%–1.9%, while select high-yield sectors offer 4%–9%.
India’s REIT market, worth ₹1.2 lakh crore in 2026, delivers quarterly distributions averaging 7.2%–8.5% annually — among the most tax-efficient income instruments available to Indian retail investors.
Table 1 — India Dividend Market Overview 2026
| Metric | 2026 Value | YoY Growth |
|---|---|---|
| Total NSE Dividend Payout | ₹3.2 Lakh Crore | +14.6% |
| PSU Dividend Distribution | ₹87,000 Crore | +12.3% |
| India REIT Market Cap | ₹1.2 Lakh Crore | +28.4% |
| Avg REIT Distribution Yield | 7.8% | +0.4 ppts |
| Nifty 50 Dividend Yield | 1.75% | Stable |
| High-Yield Sector Range | 4%–9% | Expanding |
Key Data Insights
Not all dividends are equal. PSU banks, oil & gas, utilities, and REITs consistently outperform as dividend payers. Coal India has maintained a dividend yield above 6.5% for four consecutive years. ONGC and NTPC average 4.8%–6.2% annually.
Dividend reinvestment (DRIP) dramatically accelerates compounding. A ₹50 lakh investment growing at 8% yield + 7% capital appreciation compounds to ₹1.87 crore in 8 years — enough to fund ₹1 lakh/month.
Table 2 — Top Dividend-Yielding Asset Classes in India (2026)
| Asset Class | Avg Yield | Frequency | Tax Treatment |
|---|---|---|---|
| PSU Stocks (Coal India, ONGC) | 6.0–7.5% | Annual/Interim | Taxed at slab rate |
| Indian REITs | 7.2–8.5% | Quarterly | Partially tax-free |
| Dividend ETFs (Nifty Div 50) | 4.5–5.5% | Semi-annual | Taxed at slab rate |
| Corporate Bonds / NCDs | 8.5–10% | Monthly/Annual | Taxed at slab rate |
| InvITs (Infrastructure) | 9.0–11% | Quarterly | Partially tax-free |
| Liquid / Debt MFs (IDCW) | 6.0–7.5% | Monthly | Taxed at slab rate |
*Yields as of Q1 2026. Past distributions do not guarantee future payouts.
Investment Strategy
Building a ₹1 lakh/month dividend machine requires diversification across 4–6 asset classes. A single-sector portfolio is fragile; dividend cuts in one sector can collapse your income stream entirely. Spread risk, stagger payment cycles, and target a blended yield of 7.5%–8%.
Table 3 — Recommended Portfolio Allocation (₹1.5 Crore Corpus)
| Asset Class | Allocation % | Amount (₹) | Expected Annual Income |
|---|---|---|---|
| PSU High-Dividend Stocks | 30% | 45,00,000 | ₹3,15,000 |
| Indian REITs (Embassy, Mindspace) | 20% | 30,00,000 | ₹2,34,000 |
| InvITs (PowerGrid, Highways) | 15% | 22,50,000 | ₹2,02,500 |
| Dividend ETFs / Large Cap MFs | 15% | 22,50,000 | ₹1,12,500 |
| NCDs / Corporate Bonds | 12% | 18,00,000 | ₹1,62,000 |
| Debt/Liquid MFs (IDCW) | 8% | 12,00,000 | ₹84,000 |
| TOTAL | 100% | ₹1,50,00,000 | ₹11,10,000/yr |
Blended yield = ~7.4%. Monthly income = ₹92,500–₹1,05,000 (pre-tax). Adjust for 30% slab to net ~₹65,000–₹73,000 after tax.
Pro tip: Stagger your holdings across quarterly (REITs, InvITs), semi-annual (ETFs), and annual (PSU stocks) payers. This creates a near-monthly cash-flow cadence even when individual instruments pay quarterly.
Growth Forecast (2027–2032)
India’s dividend ecosystem is projected to grow at a CAGR of 13.8% through 2032, driven by rising corporate profitability, mandatory REIT distribution norms, and expanding InvIT pipeline. A corpus of ₹1.5 crore today could naturally generate ₹1.5–₹1.8 lakh/month by 2030 — without adding fresh capital.
Table 4 — Dividend Income Growth Forecast (2026–2032)
| Year | Corpus Value | Blended Yield | Annual Dividend | Monthly Income |
|---|---|---|---|---|
| 2026 | ₹1.50 Cr | 7.4% | ₹11.1 L | ₹92,500 |
| 2027 | ₹1.63 Cr | 7.6% | ₹12.4 L | ₹1,03,000 |
| 2028 | ₹1.78 Cr | 7.8% | ₹13.9 L | ₹1,15,800 |
| 2030 | ₹2.12 Cr | 8.1% | ₹17.2 L | ₹1,43,300 |
| 2032 | ₹2.56 Cr | 8.4% | ₹21.5 L | ₹1,79,200 |
Assumes 9% average capital appreciation + reinvestment of 20% of dividends annually. CAGR of corpus: ~9.2%.
Table 5 — Sector-Wise Dividend CAGR Forecast (2026–2032)
| Sector | 2026 Yield | CAGR (Payout Growth) | 2032 Projected Yield |
|---|---|---|---|
| PSU Oil & Gas | 5.8% | 11.2% | 7.2% |
| Utilities (NTPC, Power Grid) | 4.6% | 13.5% | 6.4% |
| REITs | 7.8% | 9.8% | 9.1% |
| InvITs | 9.5% | 10.4% | 11.2% |
| IT / Pharma Dividend Plays | 2.8% | 16.1% | 5.2% |
Risk Analysis
Dividend investing is not risk-free. Dividend cuts, interest rate changes, regulatory shifts, and inflation can all erode your income stream. In FY2024, over 22% of Nifty 500 companies reduced or skipped dividends following margin pressures — a reminder that diversification is non-negotiable.
Table 6 — Risk vs. Reward Matrix by Asset Class
| Asset Class | Yield | Risk Level | Dividend Stability | Liquidity |
|---|---|---|---|---|
| PSU Stocks | 6–7.5% | Medium | High | High |
| REITs | 7.2–8.5% | Low-Medium | Very High | Medium |
| InvITs | 9–11% | Medium | High | Low-Medium |
| NCDs / Bonds | 8.5–10% | Medium-High | Medium | Low |
| Private Sector Stocks | 2–5% | High | Volatile | High |
| Debt MFs (IDCW) | 6–7.5% | Low | High | High |
Key risk management rules: Never allocate more than 25% to a single sector. Maintain a 6-month income buffer (₹6 lakh liquid reserve) to handle dividend pauses. Review your portfolio every quarter against payout history and company fundamentals.
Table 7 — Corpus Required vs. Monthly Income at Different Yields
| Blended Yield | For ₹75,000/mo | For ₹1,00,000/mo | For ₹1,50,000/mo |
|---|---|---|---|
| 6% | ₹1.50 Cr | ₹2.00 Cr | ₹3.00 Cr |
| 7% | ₹1.28 Cr | ₹1.71 Cr | ₹2.57 Cr |
| 7.5% | ₹1.20 Cr | ₹1.60 Cr | ₹2.40 Cr |
| 8% | ₹1.12 Cr | ₹1.50 Cr | ₹2.25 Cr |
| 9% | ₹1.00 Cr | ₹1.33 Cr | ₹2.00 Cr |
Pre-tax values. At 30% tax slab, add ~43% to corpus targets for equivalent post-tax income.
Conclusion
Generating ₹1,00,000 per month in dividend income is entirely achievable in 2026 with a disciplined, diversified corpus of ₹1.5–₹1.75 crore. The strategy is simple: own high-quality, yield-generating assets, reinvest a portion of payouts, and rebalance annually.
India’s dividend market is growing at 13.8% CAGR through 2032. REITs and InvITs alone can anchor 35% of your portfolio with predictable quarterly distributions. Add PSU stalwarts and debt instruments to complete the picture.
Start today, stay consistent, and let compounding do the heavy lifting. ₹3,333 a day is not luck — it is a system.
✦Frequently Asked Questions
Q1. How much money do I need to generate ₹1 lakh per month in dividends?
At a blended yield of 8%, you need approximately ₹1.50 crore pre-tax. If you’re in the 30% tax bracket and want ₹1 lakh net, target a corpus closer to ₹2.14 crore.
Q2. Are dividends from REITs tax-free in India?
REIT distributions are partially tax-exempt. The dividend component is taxed at your slab rate, but the interest and amortization components are tax-free, making REITs one of the most tax-efficient income instruments in India.
Q3. Which Indian stocks pay the highest dividends in 2026?
Top yielders include Coal India (6.8%+), ONGC (5.5%+), NTPC (4.8%), Power Grid (4.6%), and Vedanta (8%+). However, Vedanta carries higher risk due to leverage. PSU stocks are generally safer for dividend reliability.
Q4. Can I build a ₹1.5 crore corpus starting from zero?
Yes. Investing ₹50,000/month via SIP in equity funds at a 12% CAGR grows to ₹1.67 crore in approximately 13 years. Increasing SIP by 10% annually can cut this timeline to 10–11 years.
Q5. What is the biggest risk in dividend investing in India?
The biggest risks are dividend cuts, inflation eroding real income, and concentration risk. Mitigate by diversifying across 6+ asset classes, maintaining a 6-month cash buffer, and reviewing dividend payout ratios (ideal: 35%–55%) annually.


1 thought on “₹3,333 a Day: How to Generate a ₹1,00,000 Monthly Dividend Income”