1. Introduction
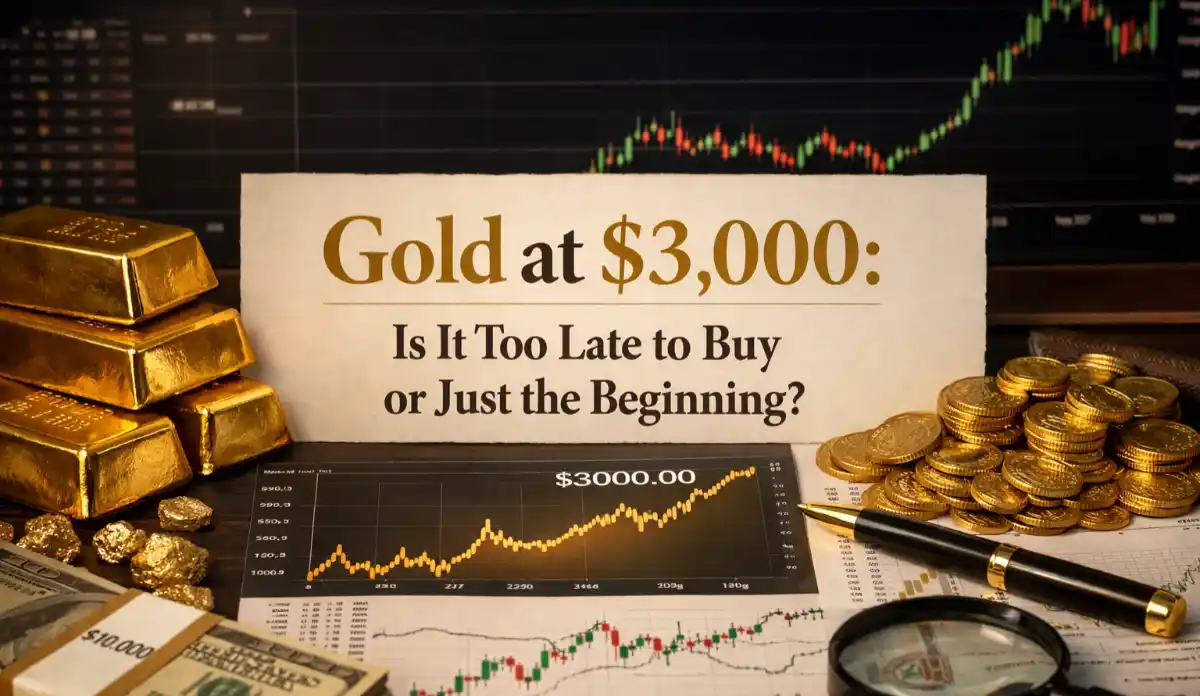
When gold smashed through the $3,000/oz barrier in early 2025, skeptics called it a bubble. Today, in April 2026, gold is trading near $4,749/oz — up over 58% from that “too-expensive” price point.
The real question was never whether $3,000 was too high. The question was whether investors understood the structural forces rewriting gold’s long-term valuation. Those who hesitated at $3,000 have already missed a 58%+ gain — but according to the world’s top financial institutions, the next chapter may be even more rewarding.
2. Market Overview
Gold hit an all-time high of $5,595/oz on January 29, 2026, before pulling back to the current range of $4,700–$4,800. This correction is widely viewed as healthy consolidation, not a trend reversal.
In 2025 alone, gold surged 55%, smashing through $4,000/oz for the first time in October. Three forces drove this historic run: a weakening U.S. dollar, record central bank purchases exceeding 1,000 tonnes annually, and persistent inflation keeping real interest rates negative.
Table 1: Gold’s Historic Price Milestones
| Milestone | Date | Price (USD/oz) |
|---|---|---|
| $2,000 crossed | Aug 2020 | $2,075 |
| $3,000 crossed | Mar 2025 | $3,000 |
| $4,000 crossed | Oct 2025 | $4,012 |
| All-time high | Jan 29, 2026 | $5,595 |
| Current price | Apr 14, 2026 | ~$4,749 |
3. Key Data Insights
Institutional demand is the bedrock of this bull market. J.P. Morgan projects central bank gold purchases will average 585 tonnes per quarter in 2026 — totaling roughly 755 tonnes annually. While slightly below the 1,000+ tonne peaks of 2022–2024, this figure is nearly double pre-2022 averages of 400–500 tonnes.
Core CPI remains stubbornly near 3.5%, well above the Fed’s 2% target. As long as inflation outpaces Treasury yields, real interest rates stay negative — historically the single most powerful driver of gold prices.
The BRICS de-dollarization trend is accelerating. China, India, and Poland are leading a structural shift away from U.S. dollar reserves, directly increasing sovereign gold demand at a pace unlikely to reverse this decade.
Table 2: Top Institutional Gold Price Forecasts — 2026 Year-End
| Institution | 2026 Target (USD/oz) |
|---|---|
| J.P. Morgan | $5,055–$6,300 |
| Wells Fargo | $6,100–$6,300 |
| Goldman Sachs | $4,628–$5,055 |
| UBS | $5,000–$5,400 |
| Commerzbank | $5,000 |
| RBC Capital Markets | $4,800 |
| Standard Chartered | $4,500 |
| Bank of America | $4,538–$5,000 |
4. Investment Strategy
Physical gold and ETFs remain the most efficient vehicles for long-term investors. Gold mining stocks offer leveraged exposure, with leading miners historically delivering 2–3x the percentage gains of spot gold in bull markets — but with higher volatility.
A balanced approach for 2026 involves 5–15% of a total portfolio in gold, depending on risk tolerance. Investors with existing equity-heavy portfolios should consider gold’s near-zero correlation with the S&P 500 as a structural hedge.
Table 3: Gold Investment Vehicles — Risk vs. Reward Comparison
| Vehicle | Expected Return (2026–2027) | Risk Level | Liquidity |
|---|---|---|---|
| Physical Gold (Bullion) | 15–25% | Low | Medium |
| Gold ETFs (e.g., GLD, IAU) | 15–25% | Low–Medium | High |
| Gold Mining Stocks | 30–60% | High | High |
| Gold Futures / CFDs | 50–100%+ | Very High | Very High |
| Gold Royalty Companies | 20–40% | Medium | High |
Dollar-cost averaging (DCA) over Q2–Q3 2026 is recommended by analysts citing the current pullback from the $5,595 all-time high as a strategic entry window. The key technical support level is $3,991.64 (the 200-period SMA) — many analysts view any deep test of this zone as a strong buy opportunity.
Table 4: Recommended Portfolio Allocation by Investor Profile
| Investor Profile | Gold Allocation | Recommended Vehicle Mix |
|---|---|---|
| Conservative (Retiree) | 10–15% | Physical + ETFs |
| Balanced (Mid-career) | 8–12% | ETFs + Royalty stocks |
| Aggressive (Growth) | 5–8% | Mining stocks + ETFs |
| Inflation Hedge Focus | 15–20% | Physical + ETFs |
| Short-term Trader | 3–5% | Futures / CFDs |
5. Growth Forecast
The consensus across major forecasters is not just bullish — it is structurally bullish. J.P. Morgan expects gold to average $5,400/oz by Q4 2027. InvestingHaven targets $6,500 by 2027 and a peak of $8,150 by 2030. Bank of America’s most extreme scenario places gold at $8,000+ in 2027 if BRICS reserve diversification accelerates further.
Table 5: Multi-Year Gold Price Forecast (2026–2032)
| Year | Bear Case | Base Case | Bull Case |
|---|---|---|---|
| 2026 | $4,082 | $5,055 | $6,376 |
| 2027 | $4,587 | $5,820 | $7,819 |
| 2028 | $5,675 | $6,521 | $9,088 |
| 2029 | $5,908 | $7,200 | $9,322 |
| 2030 | $5,930 | $8,150 | $10,000+ |
| 2031–2032 | $6,200 | $9,000 | $12,000+ |
The CAGR from current levels (~$4,749) to the 2030 base case of $8,150 is approximately 14.5% annually — meaningfully outperforming the historical average S&P 500 return of 10–11%, particularly given current macro risk conditions.
Table 6: Estimated CAGR Scenarios (Base: $4,749 in April 2026)
| Scenario | 2030 Price Target | CAGR (4 Years) | Total Gain |
|---|---|---|---|
| Bear | $5,930 | ~5.7% | ~25% |
| Base | $8,150 | ~14.5% | ~72% |
| Bull | $10,000 | ~20.5% | ~111% |
6. Risk Analysis
Gold is not a guaranteed return vehicle. Three primary risks could disrupt the current bull market.
First, if the Federal Reserve reverses rate cuts due to re-accelerating inflation, real yields could turn sharply positive — historically the most bearish condition for gold. Second, a rapid resolution of major geopolitical conflicts could temporarily reduce safe-haven demand by 10–15%. Third, a strong U.S. dollar rally could suppress prices for 6–12 months, as seen briefly in 2022.
Table 7: Risk Factor Analysis — 2026 Outlook
| Risk Factor | Probability | Price Impact | Recovery Window |
|---|---|---|---|
| Fed hawkish pivot | 20% | −10% to −20% | 6–12 months |
| Strong USD rally | 25% | −8% to −15% | 3–9 months |
| Geopolitical resolution | 15% | −5% to −10% | 3–6 months |
| Central bank demand slowdown | 20% | −5% to −12% | 12–24 months |
| Mining supply surge | 10% | −3% to −8% | 24–36 months |
Critically, even the most bearish institutional forecasters — HSBC and Standard Chartered — do not project gold falling below $4,082/oz. The structural demand floor built by central bank accumulation is extraordinary in historical terms.
7. Conclusion
The narrative that gold at $3,000 was “too expensive” has been proven wrong by a 58%+ rally to current levels. The same flawed logic — “it’s too late” — is being repeated today at $4,749/oz.
History, institutional consensus, and structural macro forces suggest otherwise. With J.P. Morgan targeting $5,055–$6,300 by year-end 2026, Goldman Sachs projecting $5,000+ in 2027, and long-term models pointing toward $8,000–$10,000 by 2030, the opportunity window remains open for disciplined investors.
The core insight: gold’s bull market is no longer speculative — it is structural. Central banks are buying in volume. Inflation persists above target. The dollar is weakening. De-dollarization is accelerating globally. For investors with a 3–5 year horizon, today’s price near $4,749 may well look as inexpensive as $3,000 does right now.
Always conduct your own due diligence and consult a licensed financial advisor before making any investment decisions.
Frequently Asked Questions
Q1: Is gold at $4,700+ in 2026 still a good investment?
Based on institutional forecasts from J.P. Morgan, Goldman Sachs, and UBS — targeting $5,000–$6,300 by year-end 2026 — gold still offers meaningful upside from current levels. The base-case CAGR through 2030 sits near 14.5% annually.
Q2: What is the gold price target for 2027?
Forecasts for 2027 range from $4,587 (bear case) to $7,819 (bull case). J.P. Morgan’s baseline is $5,400/oz, while InvestingHaven targets $6,500. Bank of America’s extreme scenario reaches $8,000+ if BRICS demand accelerates.
Q3: How much gold should I hold in my portfolio in 2026?
Most advisors recommend 8–15% of a portfolio in gold, depending on risk profile. Conservative investors should favor physical bullion and ETFs; growth-oriented investors may add mining stocks for 2–3x leveraged exposure to spot price moves.
Q4: What are the biggest risks to gold prices in 2026?
The top risks include a Fed hawkish pivot (20% probability), a strong U.S. dollar rally (25%), and a slowdown in central bank purchases. Even so, most bear-case forecasts keep gold well above $4,000/oz through year-end.
Q5: Could gold reach $10,000/oz by 2030?
Multiple long-range models — including bull-case scenarios from Bank of America and LongForecast — project gold above $9,000–$10,000 by 2030. This requires sustained de-dollarization, above-target inflation, and central bank accumulation of 600–800+ tonnes per year.