

1. Introduction
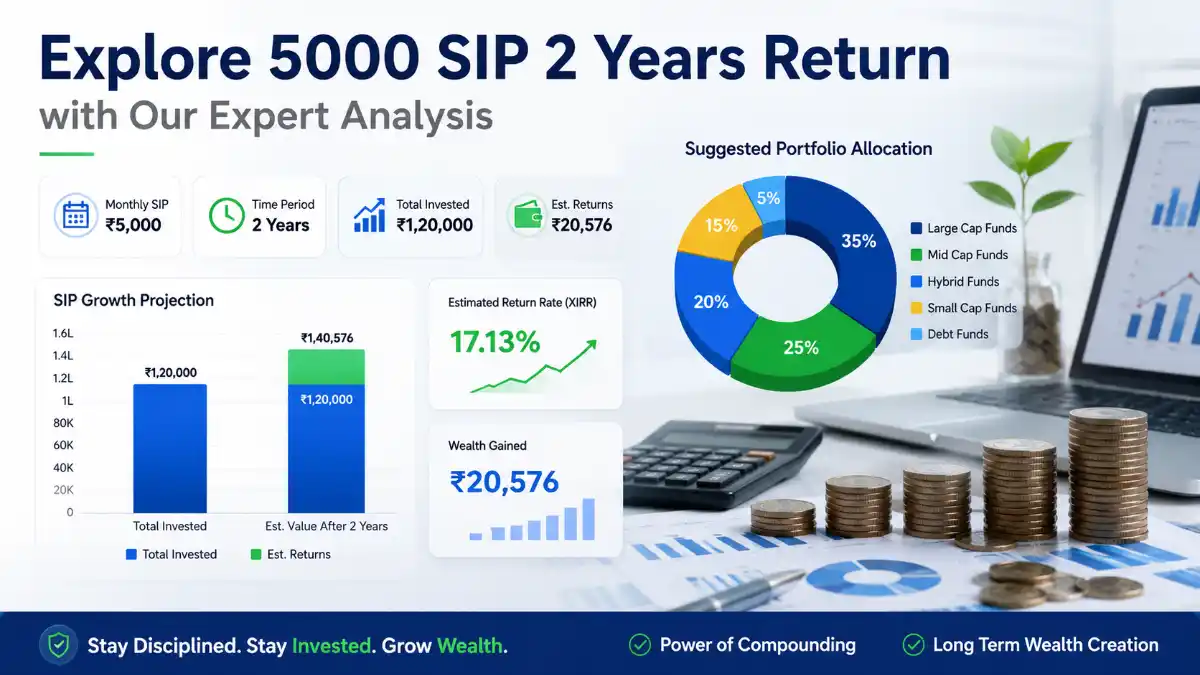
Investing ₹5,000 per month through a Systematic Investment Plan (SIP) is one of the most powerful wealth-building habits you can build in 2026. Even a modest monthly SIP can grow into ₹15–25 lakhs over 10–15 years, depending on fund category and market performance.
India’s mutual fund industry crossed ₹68 lakh crore in AUM by early 2026, with SIP contributions hitting a record ₹26,000+ crore monthly. This data confirms that retail investors are trusting SIPs more than ever—and for good reason.
This guide gives you a data-driven breakdown of where to invest ₹5,000/month in 2026, backed by CAGR projections, risk analysis, and sector-specific forecasts through 2032.
2. Market Overview
India’s equity mutual fund market is growing at a CAGR of 14.8% (2026–2032), driven by rising financial literacy, digital platforms, and a young demographic with over 50% of the population under 30.
Table 1: Indian Mutual Fund Market Projections (2026–2032)
| Year | Industry AUM (₹ Lakh Crore) | SIP Monthly Flow (₹ Crore) | Equity Fund CAGR |
|---|---|---|---|
| 2026 | 68 | 26,500 | 14.8% |
| 2027 | 78 | 30,000 | 15.1% |
| 2028 | 90 | 34,500 | 15.4% |
| 2029 | 104 | 39,000 | 15.7% |
| 2030 | 121 | 44,000 | 15.9% |
| 2032 | 162 | 55,000 | 16.2% |
Smallcap and midcap segments are projected to outperform large-caps by 3–5% annually through 2030, making them attractive for long-term SIP investors with moderate-to-high risk tolerance.
3. Key Data Insights
A ₹5,000/month SIP at 12% CAGR over 15 years generates approximately ₹25.2 lakhs, while a 15% CAGR scenario yields ₹33.8 lakhs — a 34% difference just by choosing the right fund category.
Table 2: SIP of ₹5,000/Month — Return Projections by Duration
| Duration | Total Invested | @10% CAGR | @12% CAGR | @15% CAGR | @18% CAGR |
|---|---|---|---|---|---|
| 5 Years | ₹3 Lakhs | ₹3.87L | ₹4.08L | ₹4.45L | ₹4.86L |
| 10 Years | ₹6 Lakhs | ₹10.2L | ₹11.6L | ₹13.9L | ₹16.7L |
| 15 Years | ₹9 Lakhs | ₹20.7L | ₹25.2L | ₹33.8L | ₹45.8L |
| 20 Years | ₹12 Lakhs | ₹38.3L | ₹49.9L | ₹75.8L | ₹1.15 Cr |
Key takeaway: At 18% CAGR over 20 years, a ₹5,000/month SIP can cross ₹1 crore — making fund selection critical.
4. Investment Strategy
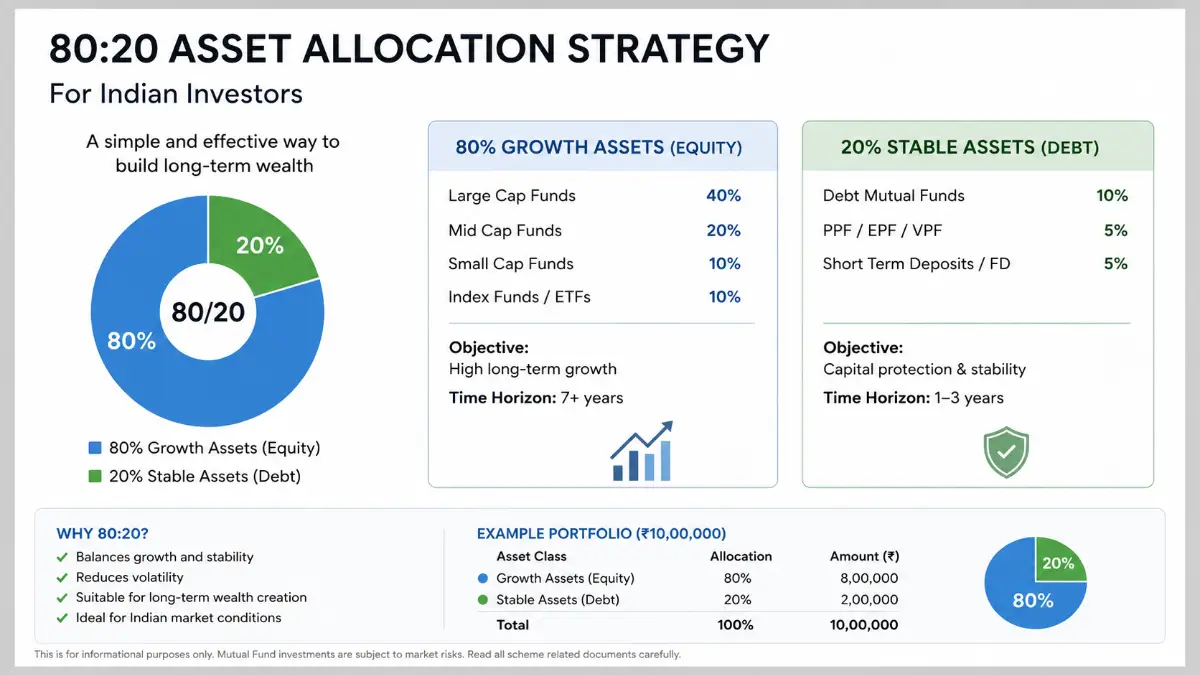
The smartest approach in 2026 is a multi-fund SIP portfolio that balances growth, stability, and sector exposure. Allocate your ₹5,000 across 2–3 funds for diversification rather than putting everything into one.
Table 3: Recommended ₹5,000/Month SIP Portfolio Allocation (2026)
| Fund Category | Monthly Allocation | Expected CAGR | Risk Level | Best For |
|---|---|---|---|---|
| Large Cap Fund | ₹1,500 (30%) | 11–13% | Low-Medium | Stability |
| Flexi Cap Fund | ₹1,500 (30%) | 13–15% | Medium | Balanced Growth |
| Midcap Fund | ₹1,000 (20%) | 15–18% | Medium-High | Aggressive Growth |
| Smallcap Fund | ₹500 (10%) | 16–20% | High | High Returns |
| ELSS (Tax Saving) | ₹500 (10%) | 12–16% | Medium | Tax + Returns |
Pro Tip: ELSS funds save up to ₹46,800 in taxes annually under Section 80C while delivering equity-linked returns — making them a must-have in any ₹5,000 SIP plan.
5. Growth Forecast by Fund Category
Sector-specific funds show explosive growth potential through 2032. Technology, healthcare, and green energy are the three sectors with the strongest CAGR outlook for equity SIP investors.
Table 4: Sector-Wise Equity Fund CAGR Forecast (2026–2032)
| Sector | 2026 CAGR | Projected 2032 CAGR | Growth Driver |
|---|---|---|---|
| Technology & IT | 14.5% | 17.8% | AI, cloud, digital infrastructure |
| Healthcare & Pharma | 13.8% | 16.5% | Aging population, biotech R&D |
| Green Energy | 16.2% | 19.3% | India’s 500 GW renewable target |
| Banking & Finance | 12.9% | 15.1% | Credit growth, digital banking |
| Consumer Discretionary | 11.4% | 14.2% | Rising middle class spending |
| Infrastructure | 15.1% | 17.6% | ₹11 lakh crore capex budget |
India’s infrastructure outlay of ₹11.11 lakh crore in FY2026 directly fuels infrastructure and capital goods funds — an underutilized category for SIP investors.
6. Risk Analysis
Every investment carries risk. Understanding the risk-reward tradeoff before choosing your SIP category is non-negotiable in 2026’s volatile global environment.
Table 5: Risk vs. Reward — SIP Fund Categories Compared
| Fund Type | Volatility (Std Dev) | Max Drawdown Risk | Avg Recovery Time | Reward Potential |
|---|---|---|---|---|
| Large Cap | 12–14% | 20–25% | 12–18 months | Moderate (★★★) |
| Flexi Cap | 14–17% | 25–30% | 14–20 months | Good (★★★★) |
| Midcap | 18–22% | 35–40% | 18–24 months | High (★★★★) |
| Smallcap | 22–28% | 45–55% | 24–36 months | Very High (★★★★★) |
| ELSS | 14–18% | 28–35% | 16–22 months | Good (★★★★) |
Key risk rule: Smallcap funds can fall 45–55% in bear markets. Never invest in smallcap SIPs with a horizon under 7 years.
Table 6: SIP Performance During Market Corrections (Historical Behavior)
| Market Phase | Large Cap Drop | Midcap Drop | Smallcap Drop | SIP Advantage |
|---|---|---|---|---|
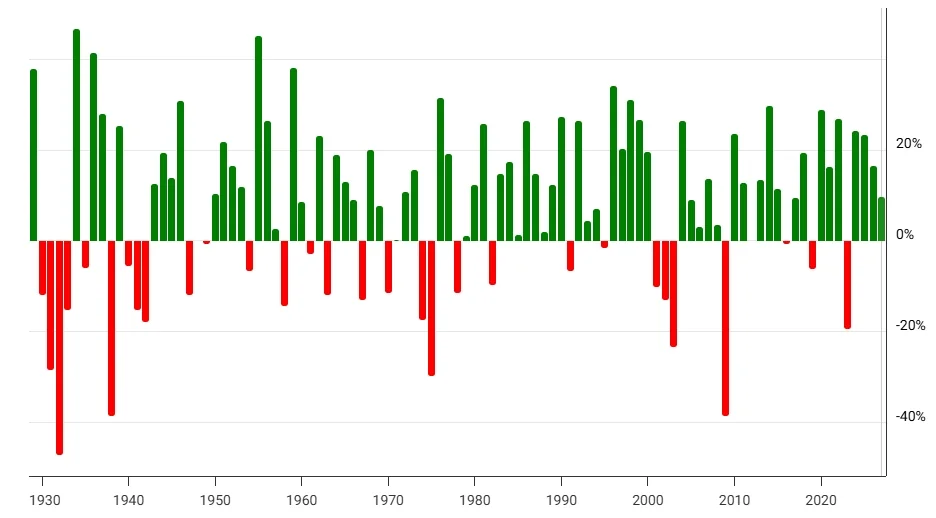
| Bear Market (>30%) | –22% | –38% | –52% | More units bought cheap |
| Sideways Market | –5 to +5% | –10 to +10% | –15 to +15% | Rupee cost averaging |
| Bull Market (>20%) | +18–22% | +28–35% | +38–50% | Compounding accelerates |
SIP’s biggest advantage is rupee cost averaging — during downturns, your ₹5,000 buys more units, reducing average cost and amplifying future gains.
7. Conclusion
Investing ₹5,000 per month via SIP in 2026 is not just smart — it’s one of the highest-ROI financial decisions available to Indian retail investors. With India’s GDP projected to reach $5.8 trillion by 2030 and equity markets expected to compound at 14–16% annually, the next 5–7 years represent a golden window.
A diversified SIP portfolio across large cap (30%), flexi cap (30%), midcap (20%), smallcap (10%), and ELSS (10%) gives you the optimal mix of stability, growth, and tax efficiency.
Start today, stay consistent, and let compounding do the heavy lifting. A 10-year SIP of ₹5,000/month has the realistic potential to grow into ₹11–17 lakhs — purely from disciplined, automated investing.
FAQs
Q1. What is the best SIP for ₹5000 per month in 2026?
A diversified combination of a large cap fund, flexi cap fund, and ELSS is considered the best approach. Flexi cap funds currently deliver a projected CAGR of 13–15%, making them the most versatile choice.
Q2. How much will ₹5,000/month SIP grow in 10 years?
At 12% CAGR, a ₹5,000/month SIP grows to approximately ₹11.6 lakhs in 10 years against a total investment of ₹6 lakhs — a near 2x return.
Q3. Is SIP safe for long-term investing?
Equity SIPs carry market risk but historically, every 10-year SIP window in Indian markets since 1995 has delivered positive returns, with most delivering 10–16% CAGR.
Q4. Can I split ₹5,000 SIP across multiple funds?
Yes. Splitting across 2–3 funds is recommended. Allocate ₹1,500–2,000 to a core large/flexi cap fund and ₹500–1,000 each to midcap and ELSS for balanced exposure.
Q5. Which SIP is best for tax saving with ₹5,000/month?
ELSS (Equity Linked Savings Scheme) funds qualify for ₹1.5 lakh annual deduction under Section 80C, and with a 3-year lock-in, they are the most tax-efficient equity SIP available in 2026.


4 thoughts on “Best SIP for ₹5000 Per Month: Top Funds, Returns & Smart Strategy”