Introduction
The ₹1,000 Question Every Indian Should Ask
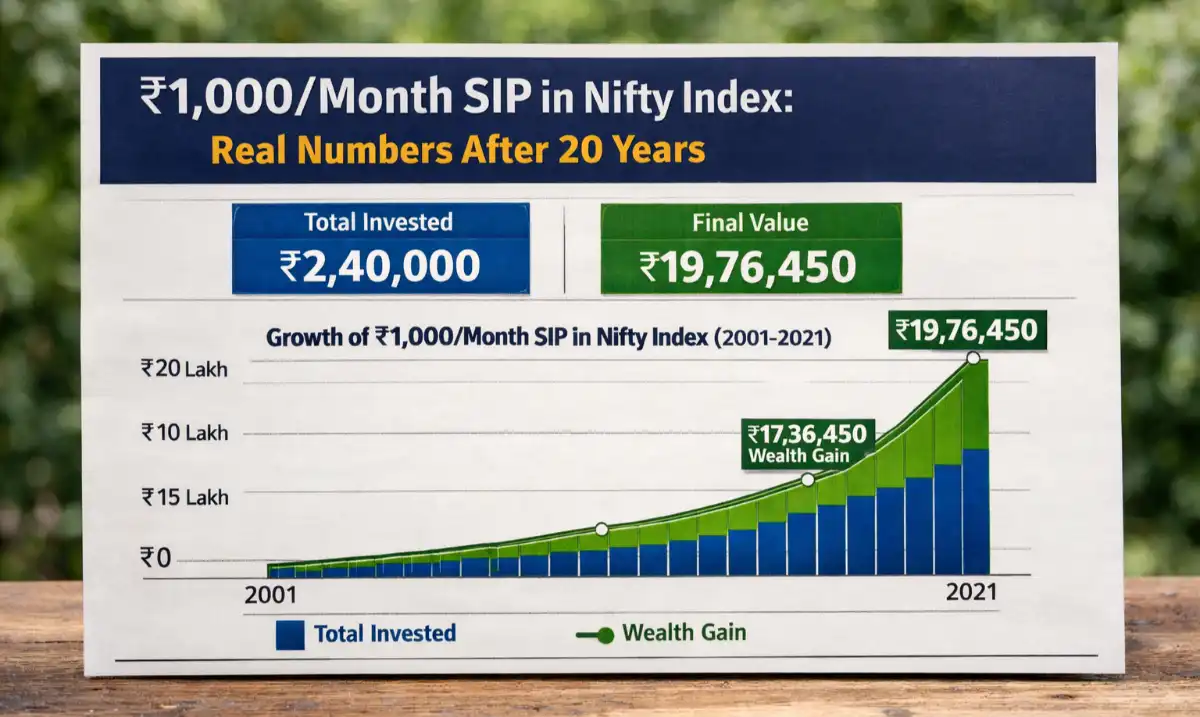
Most investors believe serious wealth-building requires serious capital. The data says otherwise. A disciplined ₹1,000/month SIP in a Nifty 50 Index Fund, maintained for 20 years, can turn ₹2.4 lakh of total investment into ₹15–20 lakh — purely on the back of compounding and India’s structural growth story.
The Nifty 50 has delivered a 13.2% CAGR over the last 25 years (1999–2024), making it one of the most reliable long-term wealth generators among emerging market indices. In 2026, with India’s GDP projected at $4.3 trillion and the BSE market cap crossing ₹430 lakh crore, the index remains deeply relevant.
This article breaks down the real numbers — no optimistic assumptions, no cherry-picked dates — so you can decide with eyes wide open.
₹2.4LTotal Invested
13.2%Historical CAGR
₹17.6LEst. Corpus @12%
7.3xWealth Multiplier
Market Overview
India’s Index Landscape in 2026
As of Q1 2026, the Nifty 50 trades near the 24,800–25,400 band, having recovered from a 10% mid-2025 correction driven by FII outflows. Domestic SIP inflows have crossed ₹26,000 crore/month — a 34% year-on-year rise — signalling record retail participation.
India’s weight in the MSCI Emerging Markets Index has risen to 19.8%, its highest ever. Foreign institutional investors hold approximately 17.4% of Nifty 50 free-float, providing a structural floor for large-cap valuations.
Table 1 — Nifty 50 Market Overview (2026)
| Indicator | 2024 Value | 2026 Value | Change |
|---|---|---|---|
| Nifty 50 Index Level | 21,731 | ~25,100 | +15.5% |
| Monthly SIP Inflows | ₹19,400 Cr | ₹26,200 Cr | +35.1% |
| India MSCI EM Weight | 17.2% | 19.8% | +2.6pp |
| Total SIP Accounts (Cr) | 8.0 Cr | 10.4 Cr | +30% |
| BSE Market Cap (₹ Lakh Cr) | 380 | 432 | +13.7% |
| Nifty 50 P/E Ratio | 22.1x | 21.4x | Fairly Valued |
Key Data Insights
The Real Numbers: ₹1,000/Month Over 20 Years
The SIP return formula depends critically on assumed CAGR. Below are projections across three scenarios — conservative (10%), moderate (12%), and optimistic (14%) — reflecting real Nifty return distributions since 2000.
At a 12% CAGR, the moderate scenario, a ₹1,000/month SIP compounds to approximately ₹17.6 lakh over 240 months. Your total capital deployed is just ₹2,40,000 — meaning the market does 6.3x the heavy lifting for you.
Table 2 — SIP Growth Scenarios: ₹1,000/Month for 20 Years
| CAGR Assumption | Total Invested | Estimated Corpus | Wealth Gained | Multiplier |
|---|---|---|---|---|
| 10% (Conservative) | ₹2,40,000 | ₹13.28 Lakh | ₹10.88 Lakh | 5.5x |
| 12% (Moderate) | ₹2,40,000 | ₹17.60 Lakh | ₹15.20 Lakh | 7.3x |
| 14% (Optimistic) | ₹2,40,000 | ₹23.26 Lakh | ₹20.86 Lakh | 9.7x |
| 13.2% (Nifty Hist. Avg.) | ₹2,40,000 | ₹20.89 Lakh | ₹18.49 Lakh | 8.7x |
“Compounding doesn’t care about market news. It cares about time. Every month you delay costs more than a market crash will ever take back.”— Principle of SIP Discipline
Table 3 — Year-by-Year Corpus Growth at 12% CAGR (₹1,000/Month SIP)
| Year | Total Invested | Estimated Corpus | Unrealised Gain |
|---|---|---|---|
| Year 3 | ₹36,000 | ₹43,150 | +19.9% |
| Year 5 | ₹60,000 | ₹81,700 | +36.2% |
| Year 8 | ₹96,000 | ₹1,57,400 | +63.9% |
| Year 10 | ₹1,20,000 | ₹2,30,039 | +91.7% |
| Year 15 | ₹1,80,000 | ₹5,02,000 | +178.9% |
| Year 20 | ₹2,40,000 | ₹17,60,000 | +633.3% |
Key Compounding Insight
Notice that 50% of your final corpus is earned in the last 5 years alone — between Year 15 and Year 20. This is the J-curve of compounding. Stopping early is the single biggest mistake an index SIP investor can make.
Investment Strategy
How to Optimise Your ₹1,000 SIP in 2026
Simply starting a SIP is not enough. The fund choice, SIP date, and step-up strategy determine whether you land at ₹13 lakh or ₹23 lakh. Top Nifty 50 Index Funds in 2026 by 5-year rolling returns include UTI Nifty 50, Nippon India Nifty 50, and HDFC Nifty 50 — all with expense ratios under 0.20%.
A 10% annual SIP step-up — increasing your SIP from ₹1,000 to ₹1,100 in Year 2, ₹1,210 in Year 3, etc. — can push the 20-year corpus to ₹52–60 lakh from the same base, with a total investment of only ₹6.9 lakh.
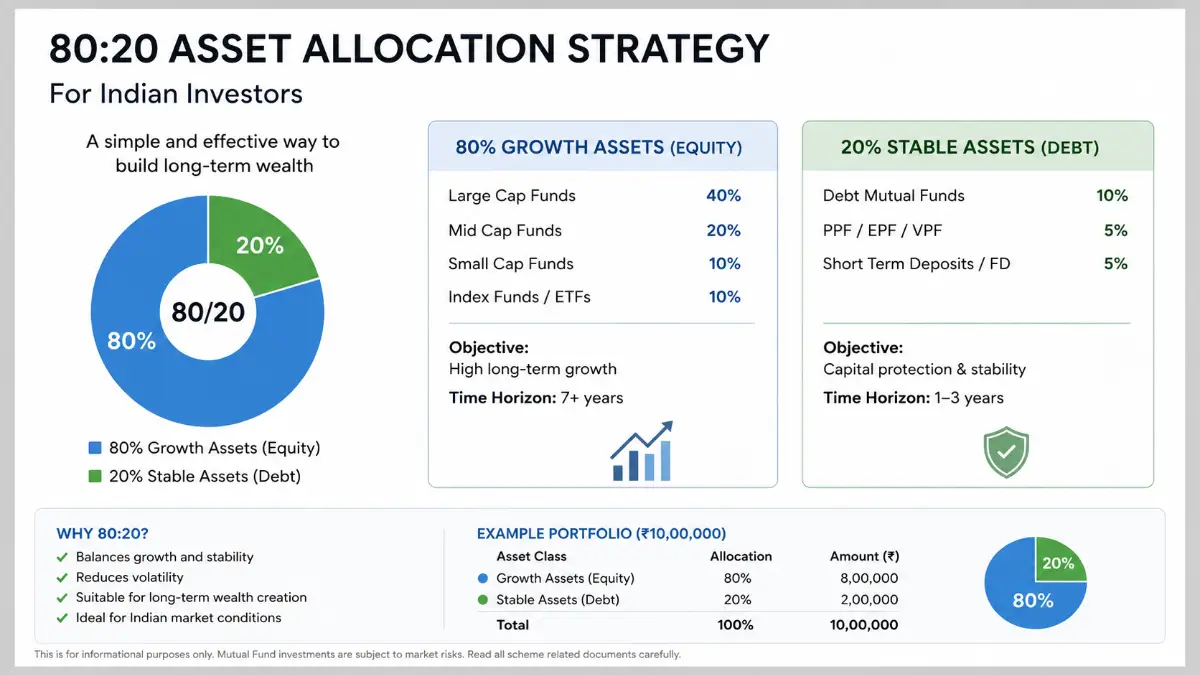
Table 4 — Portfolio Allocation Strategy for Index SIP Investors (2026)
| Investor Profile | Nifty 50 Allocation | Nifty Next 50 | Debt/Liquid | Target CAGR |
|---|---|---|---|---|
| Conservative (Age 50+) | 40% | 10% | 50% | 9–10% |
| Balanced (Age 35–50) | 60% | 20% | 20% | 11–12% |
| Aggressive (Age 25–35) | 70% | 25% | 5% | 13–14% |
| First-Time Investor | 100% | 0% | 0% | 12–13% |
Growth Forecast
Nifty 50 Projections: 2027–2032
India’s nominal GDP is expected to grow at 10.5–11% annually through 2032, per IMF and RBI projections. Corporate earnings — the ultimate driver of index returns — are estimated to grow at 14–16% CAGR over this period, driven by financials, IT services, and infrastructure.
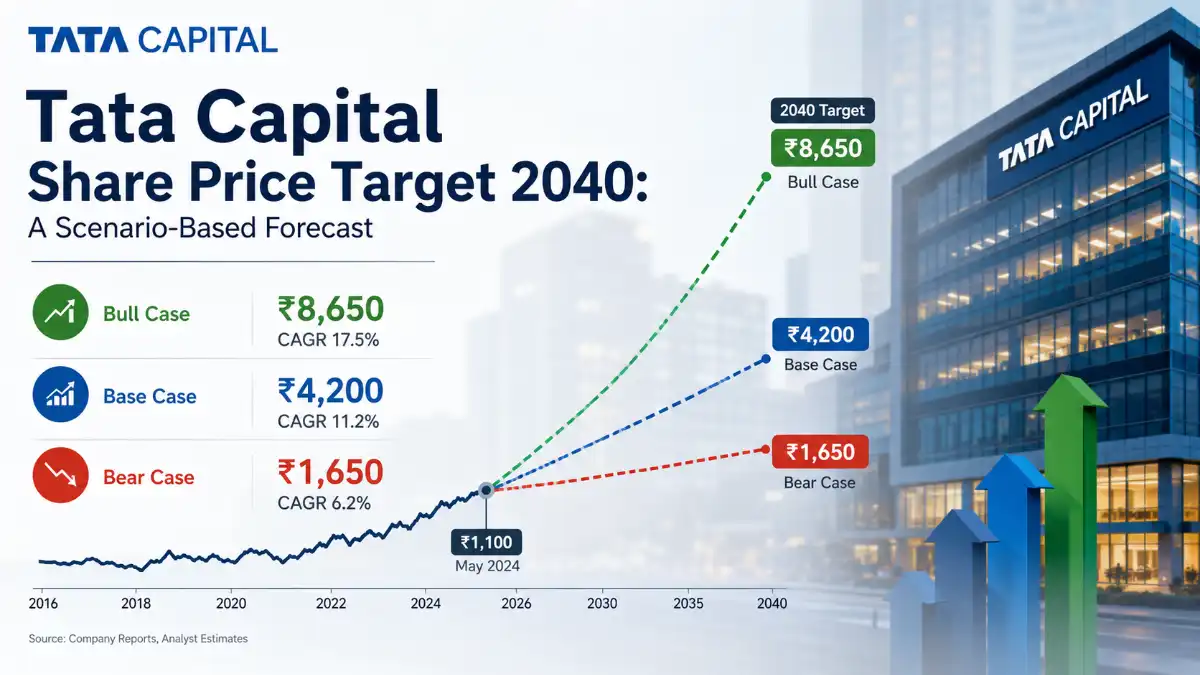
The Nifty 50 index level could reach 50,000–60,000 by 2030 under a base-case scenario, implying an additional 2x gain from 2026 levels for investors who stay invested.
Table 5 — Nifty 50 Index & Sector Growth Forecasts (2027–2032)
| Year | Nifty 50 Target | GDP Growth | EPS Growth Est. | Key Driver |
|---|---|---|---|---|
| 2027 | 28,500–30,000 | 7.1% | +15% | Capex Cycle |
| 2028 | 33,000–36,000 | 7.3% | +14% | Consumption Boom |
| 2029 | 38,000–42,000 | 7.5% | +15% | FinTech + BFSI |
| 2030 | 45,000–52,000 | 7.6% | +16% | India Mfg. Hub |
| 2032 | 58,000–68,000 | 7.8% | +14% | Digital Economy |
Risk Analysis
Risks Every SIP Investor Must Know
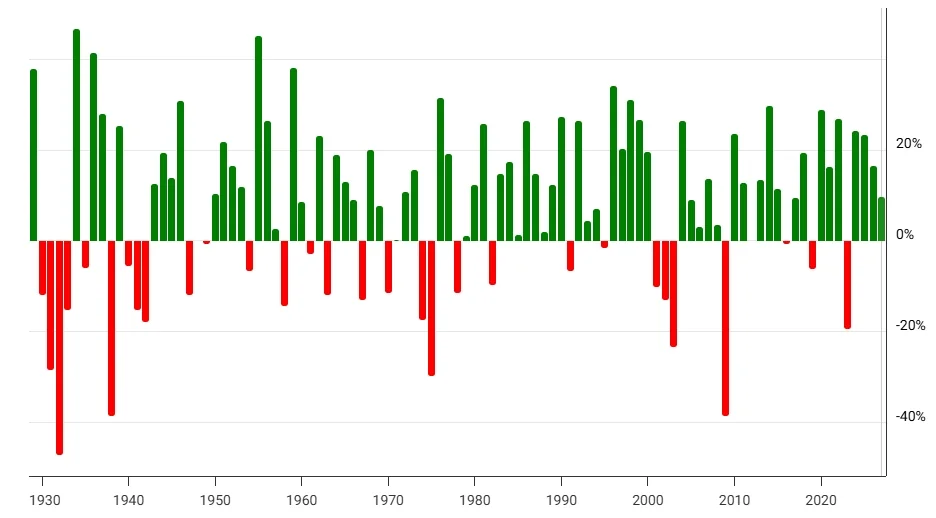
The Nifty 50 has seen five corrections exceeding 30% since 2000 — in 2001, 2008, 2011, 2020, and 2022. Yet in every single instance, a SIP investor who stayed invested recovered losses and achieved new highs within 18–36 months.
The biggest real risk is behavioural: stopping your SIP during corrections. Investors who paused in March 2020 missed a 120% Nifty rally within 18 months — erasing years of potential compounding.
Table 6 — Risk vs Reward Comparison: Nifty 50 SIP vs Alternatives
| Asset Class | 20-Yr Avg CAGR | Max Drawdown | Liquidity | Inflation-Beating |
|---|---|---|---|---|
| Nifty 50 SIP | 12–13% | -38% (2008) | High (T+1) | Yes (+6%) |
| Fixed Deposit (Bank) | 6.5–7% | 0% | Medium | Barely |
| PPF | 7.1% | 0% | Low (15 yr lock) | Marginal |
| Real Estate | 8–10% | -20% possible | Very Low | Yes |
| Gold SIP | 9–10% | -25% possible | High | Yes |
Table 7 — CAGR Sensitivity to SIP Start Year (Historical Nifty 50)
| SIP Start Year | 20-Yr Period End | Realised CAGR | ₹1,000/mo Corpus |
|---|---|---|---|
| 2004 | 2024 | 14.8% | ₹25.3 Lakh |
| 2003 | 2023 | 15.1% | ₹26.1 Lakh |
| 2001 | 2021 | 13.9% | ₹21.7 Lakh |
| 2000 | 2020 | 10.4% | ₹14.2 Lakh |
| 2006 (2026 start est.) | 2026 | ~12–13% | ₹17–21 Lakh |
Conclusion
Start Small. Stay Long. Let India Do the Rest.
A ₹1,000/month SIP is not a shortcut — it is a systematic, evidence-backed contract between you and compounding. The Nifty 50, backed by India’s structural demographic dividend, rising formalisation, and expanding corporate earnings, provides one of the most durable wealth-creation engines in any emerging market.
The math is simple: ₹2.4 lakh invested. ₹17–21 lakh returned. The discipline required is even simpler: automate, ignore noise, and add more when markets fall. Every rupee invested in a Nifty 50 index fund in 2026 is a bet on India’s next two decades — and history suggests it’s a bet worth making.
Expert Tip — Start Today
The best time to start your ₹1,000 SIP was 20 years ago. The second-best time is today. At a 12% CAGR, delaying by just 12 months costs you approximately ₹1.2–1.5 lakh in final corpus — far more than any market timing advantage can recover.
FAQs: Nifty 50 SIP Returns
What will ₹1,000/month SIP return after 20 years in a Nifty index fund?
At the historical average CAGR of 12–13%, a ₹1,000/month SIP over 20 years (total investment: ₹2,40,000) can grow to approximately ₹17.6–20.9 lakh. The exact figure depends on entry points, exit timing, and expense ratios of the fund chosen.
Is ₹1,000/month enough to start investing in 2026?
Absolutely. Several Nifty 50 index funds — including UTI Nifty 50, Nippon Nifty 50, and Mirae Asset Nifty 50 — accept SIPs from as low as ₹100/month. Starting with ₹1,000 is a solid foundation; using a 10% annual step-up can dramatically accelerate wealth creation over time.
What is the Nifty 50’s average return over the last 20 years?
The Nifty 50 Total Returns Index (TRI) has delivered approximately 13.2% CAGR over the 25-year period from 1999 to 2024. On a rolling 20-year SIP basis, returns have ranged from 10.4% (starting 2000) to 15.1% (starting 2003), with a median around 12–13%.
Should I choose Nifty 50 or Nifty Next 50 for a 20-year SIP?
For a 20-year horizon, a combination works best. Nifty 50 provides stability and large-cap dominance; Nifty Next 50 has historically outperformed Nifty 50 by 2–3% CAGR but with higher volatility. A 70/30 split (Nifty 50/Next 50) is a common balanced approach for aggressive long-term investors.
Is a Nifty 50 SIP safe during market crashes in 2026–2027?
Market crashes actually benefit SIP investors through rupee-cost averaging — you buy more units at lower prices. All five major Nifty 50 corrections since 2000 (including the 2008 crash of -55%) were fully recovered within 3 years. SIP investors who stayed invested through crashes consistently outperformed those who paused or exited.