TL;DR: With 15 years, you have enough runway to ride out market cycles and harness the full power of compounding. The optimal strategy for most investors: capture your employer’s full 401(k) match first, then max a Roth IRA ($7,000/year in 2026), then return to your 401(k). Inside those accounts, hold a simple three-fund portfolio (US stocks + international stocks + bonds) with 80–95% in equities. Keep costs below 0.10%. Automate monthly contributions and never panic-sell. That’s genuinely it.
Fifteen years is a long time – and it isn’t. Long enough that $500 a month, invested consistently, can compound into $205,000. Long enough that every major market crash in recorded history has fully recovered with time to spare. But short enough that the decisions you make now actually matter, and mistakes you postpone fixing will cost you.
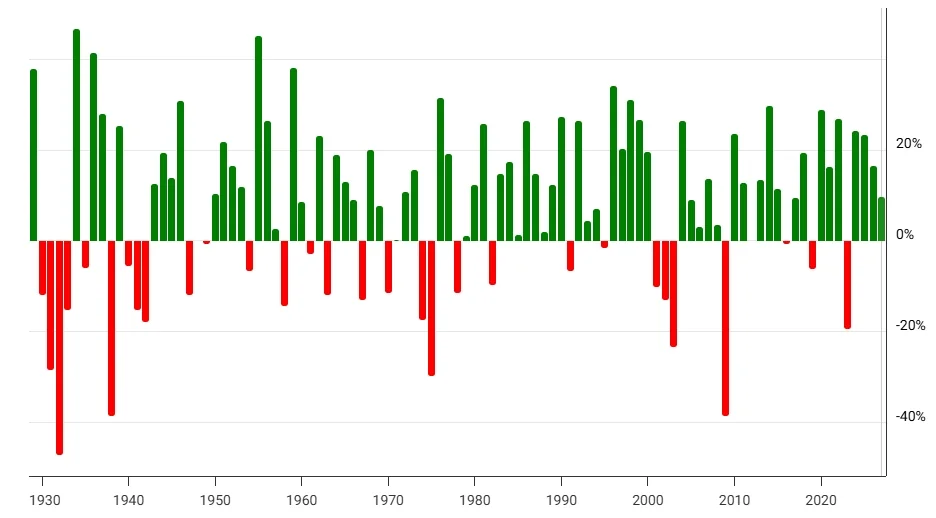
The S&P 500 has never produced a negative return over any 20-year rolling period in its history. Over 15-year periods since 1957, the result is nearly as consistent. The math doesn’t require market-timing, stock-picking, or a high-paid financial advisor. It requires a coherent plan, low costs, and the discipline to stay the course when markets get ugly.
This guide gives you that plan.
Why a 15-Year Horizon Changes Everything
Most investors think about returns as annual figures – “the market was up 14% last year.” But compounding doesn’t work on annual returns. It works on time. And with 15 years, you have enough of it to absorb 1–2 full market cycles without derailing your outcome.
Look at what the S&P 500 has actually returned by decade:
- Since 1957: 10.56% average annual return (source: Investopedia)
- Last 30 years (1996–2025): 10.4%
- Last 20 years (2006–2025): 11% – which includes the 2008 financial crisis
- Last 10 years (2016–2025): 14.8%
- Inflation-adjusted long-run average: approximately 6.7–6.8%
The pattern is clear: equity markets reward patience. And 15 years is enough patience to capture that reward even if you start at the wrong moment.
Here’s what that looks like in real dollars, assuming a 10% average annual return:
| Monthly investment | 15-year total |
|---|---|
| $500/month | ~$205,000 |
| $1,000/month | ~$414,000 |
| $2,000/month | ~$828,000 |
These aren’t lottery numbers. They’re the output of an ordinary savings habit, a broad index fund, and compound interest doing what it does over time.
Step 1: Define Your Goal – Then Pick the Right Account
The first decision shapes everything else. A 15-year horizon can mean very different things: retirement for someone in their 40s, a child’s college fund for a parent with a toddler, or financial independence for an early career professional. Each goal suggests different account types.
For retirement goals, your money belongs in tax-advantaged accounts – 401(k)s and IRAs. These accounts give your investments a shelter from annual taxes that materially changes your 15-year outcome.
For non-retirement goals (college savings, a business down payment, a second home), you’ll eventually need a taxable brokerage account – but that comes after you’ve maxed the tax-advantaged options.
The optimal account sequence for most investors
The community consensus – validated by the Bogleheads forum, r/personalfinance, and the math – is this order:
- 401(k) up to the employer match – this is an immediate 50–100% return on those dollars before the market has done anything. Never leave it on the table.
- Max your Roth IRA ($7,000/year in 2026; $8,600 if you’re 50+) – tax-free growth for 15 years is enormously valuable.
- Return to your 401(k) up to the IRS limit ($23,500 in 2026; $31,000 if 50+).
- Taxable brokerage account for any remaining savings.
The math on the employer match deserves emphasis. If your employer matches 50% of contributions up to 6% of your salary, and you earn $80,000, contributing $4,800/year earns a $2,400 match before the market opens on day one. That’s a guaranteed 50% return. No investment strategy competes with that.
Step 2: Get Your Asset Allocation Right
With 15+ years to your goal, you can afford to take on significant equity risk – and you should. The question isn’t whether to hold stocks; it’s how many.
Per Charles Schwab’s official allocation models, an aggressive investor with 15+ years to their goal should hold:
- 95% stocks
- 5% cash
- 0% bonds
Moderate investors might prefer 60% stocks / 35% bonds / 5% cash. But here’s the thing: the conventional wisdom of “hold your age in bonds” systematically underestimates how much growth long-horizon investors actually need. At 40, holding 40% bonds means giving up 15 years of equity compounding on nearly half your portfolio. Most financial planners have quietly abandoned the rule.
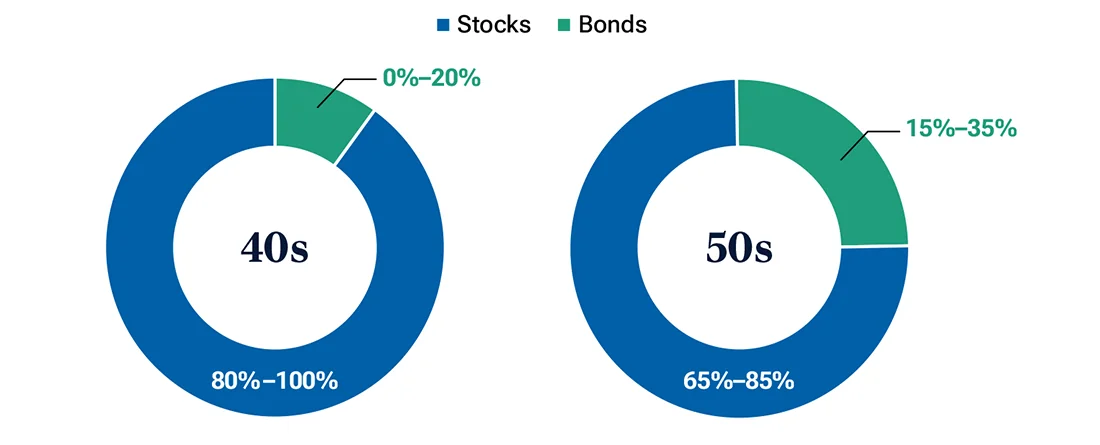
The Bogleheads community – the most data-driven community of long-term passive investors online – skews toward 80–95% stocks for anyone with 15+ years remaining. The community’s long-running mantra: “The best plan is one you can stick with.” Which means don’t hold so much in stocks that a 40% drawdown causes you to sell, but don’t hold so much in bonds that you run out of growth.
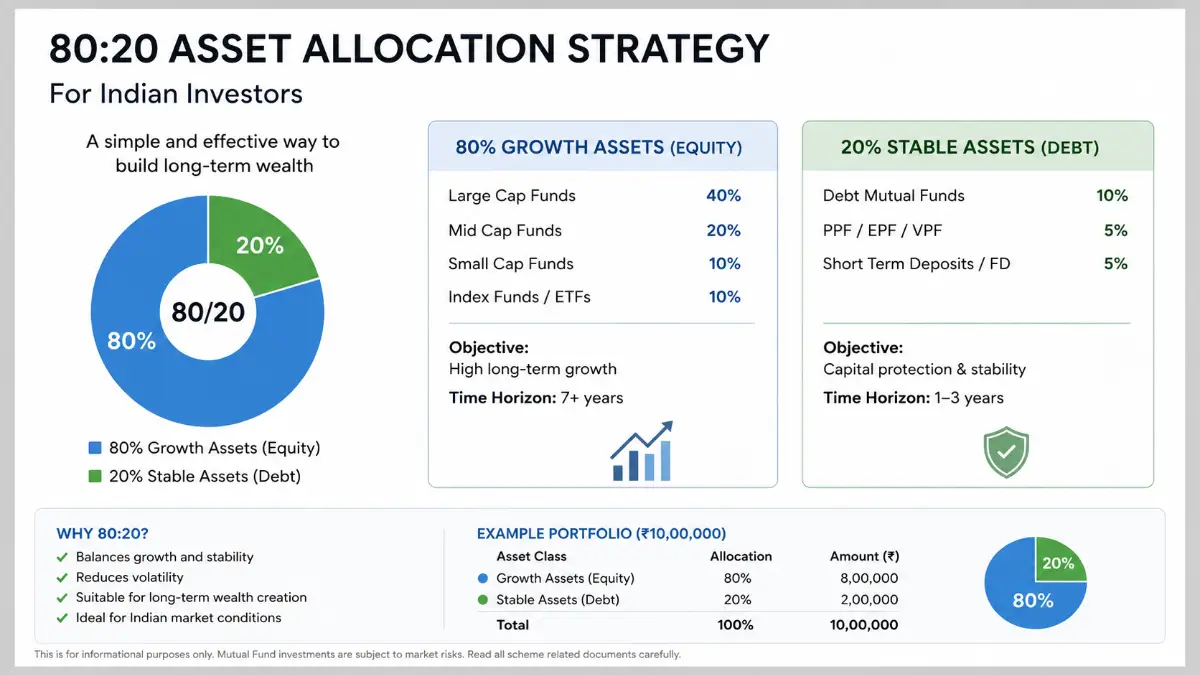
A practical starting point for most 15-year investors: 80% total stock market / 10% international stocks / 10% bonds. Adjust toward more equity if you have high job security and an emergency fund, toward more bonds if you’d genuinely panic-sell in a crash.
Step 3: Choose the Right Investment Vehicles
The “what to buy” question is simpler than the financial industry wants you to believe.
The three-fund portfolio
The Bogleheads community’s consensus recommendation for self-directed investors is the three-fund portfolio – a single asset allocation built from three broad index funds that collectively own a piece of every publicly traded company in the world.
From the Bogleheads wiki on Three-Fund Portfolios:
“You can make it really simple, be well-diversified, and do better than two-thirds of investors.”
Standard three-fund portfolio (Vanguard):
- Vanguard Total Stock Market Index (VTSAX / VTI) – US equities
- Vanguard Total International Stock Index (VTIAX / VXUS) – international equities
- Vanguard Total Bond Market Fund (VBTLX / BND) – US bonds
With Fidelity (0% expense ratios available):
- Fidelity ZERO Total Market Index Fund (FZROX)
- Fidelity ZERO International Index Fund (FZILX)
- Fidelity U.S. Bond Index Fund (FXNAX)
With Schwab:
- Schwab Total Stock Market Index (SWTSX)
- Schwab International Index (SWISX)
- Schwab U.S. Aggregate Bond Index Fund (SWAGX)
Why not just the S&P 500?
The S&P 500 is a perfectly good vehicle – but as of May 2026, the Magnificent Seven (Alphabet, Apple, Amazon, Meta, Microsoft, Nvidia, Tesla) represent 34.7% of the entire index. That’s the highest concentration since 1932. A total market fund gives you the same core holdings with broader diversification. An international fund gives you exposure to markets that may outperform the US over any given 15-year window.
What about target-date funds?
For investors who want maximum simplicity: target-date funds automatically shift from aggressive (mostly stocks) to conservative (more bonds) as you approach retirement. A Vanguard Target Retirement 2040 fund does this at a 0.10–0.15% expense ratio. It’s not the most optimized vehicle, but it’s excellent, and the biggest risk in investing is not suboptimal optimization – it’s doing nothing, or doing too much.
Step 4: Dollar-Cost Average, and Never Stop
The highest-leverage habit in long-term investing isn’t picking the right stock or timing the market. It’s automating regular contributions regardless of what the market is doing.
Dollar-cost averaging (DCA) means buying a fixed dollar amount of your chosen funds on a set schedule – say, $500 on the first of every month. When markets drop, your $500 buys more shares. When markets rise, you accumulate wealth. The math works out because you’re forced to buy more when things are cheap.
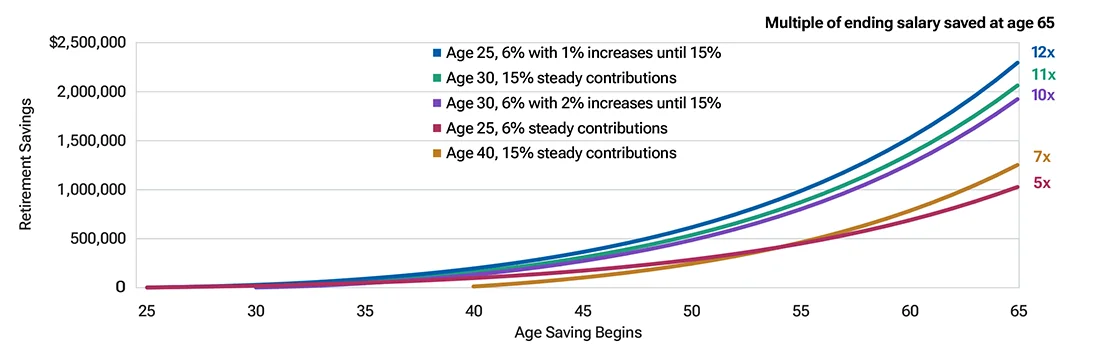
The T. Rowe Price chart above illustrates a critical point: someone who starts saving 6% of their salary at age 25 ends up with approximately twice the retirement savings of someone who starts the same savings rate at 40 – even if the 40-year-old catches up to 15% contributions later. Starting is worth more than optimizing.
Set up automatic transfers to your investment accounts on payday. Treat the contribution as a non-negotiable bill. The automation removes the emotion – you don’t have to decide each month whether “now is a good time to invest.” The decision is already made.
Step 5: Keep Costs Ruthlessly Low
This is the section that makes financial advisors uncomfortable, because the math is devastating for the industry.
A 1% annual advisory fee – common among banks and traditional wealth managers – doesn’t just cost 1% of your returns each year. Because that 1% comes out of your compounding base, it compounds against you. Over a 40-year horizon:
- A 2% fee costs you 33% of your total returns (you take 100% of the risk and keep 67% of the returns)
- A 1% fee costs you 20% of total returns
From a January 2026 Bogleheads forum thread:
“Over 1% is horrible. I’d invest in low cost index funds, and ditch the advisor… Over a 40-year period, a 2% fee means you take 100% of the risk and only get 2/3 of the returns. A 1% fee means you only get 80% of the returns.”
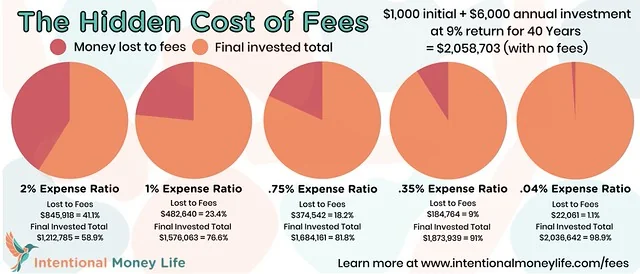
The alternative: Vanguard, Fidelity, and Schwab index funds charge 0.03–0.05% expense ratios. That’s $3–5 per year on a $10,000 investment. The same investment in a 1% fund costs $100/year – and that’s before the compounding effect. Over 15 years on a $200,000 portfolio, the fee difference is $40,000+.
The practical rule: Any fund with an expense ratio above 0.20% deserves scrutiny. Any fund above 0.50% is almost certainly underperforming its index benchmark after fees. Actively managed funds that beat the market consistently after fees over 15+ years are vanishingly rare.
Step 6: Use Tax-Advantaged Accounts Strategically
It’s not just which account you use – it’s which assets you put inside each account. This is called asset location, and it’s worth thousands over 15 years.
The principle: hold tax-inefficient assets inside accounts where they compound tax-free. Hold tax-efficient assets where the tax drag is minimal.
| Account type | Best assets to hold |
|---|---|
| Roth IRA | Taxable bonds, high-growth funds, actively managed funds |
| Traditional IRA / 401(k) | Bonds, REITs, actively managed funds |
| Taxable brokerage | Total market index ETFs, municipal bonds |
Here’s why: a bond paying 4% annual interest in a taxable account loses 22–37% of that interest to taxes every year. The same bond inside a Roth IRA compounds at the full 4%, and withdrawals in retirement are 100% tax-free. Over 15 years, that difference is material.
Per Fidelity’s asset location guide: hold your least tax-efficient assets (bonds, REITs, high-turnover funds) in your Roth IRA or traditional 401(k). Hold your most tax-efficient assets (total market index ETFs) in your taxable brokerage if you have one.
Roth vs. traditional – a quick rule of thumb
Choose Roth if you expect to be in a higher tax bracket in retirement than you are now. Choose traditional if you want the deduction now and expect lower taxes in retirement. For most 15-year investors in their 30s and 40s with room to grow their income, Roth wins.
The Behavior Gap: Why Most Investors Underperform Their Own Funds
Here’s an uncomfortable truth: the S&P 500 has returned approximately 10.56% annually since 1957. The average equity fund investor has earned significantly less – because of when they buy and sell.
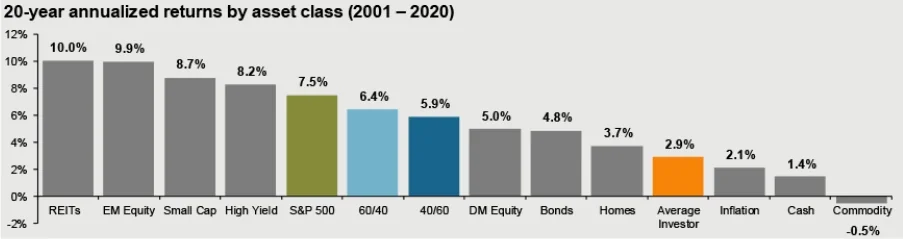
The gap between the fund return and the investor return is called the behavior gap. It exists because investors sell after crashes (locking in losses) and buy after rallies (locking in expensive prices). The pattern is almost universal and almost invisible to the people doing it – panic-selling feels rational in the moment.
From a Bogleheads member who has lived through three major crashes:
“I am financially conservative, but was 100% stocks through the dot com crash, the 2001/2003 double dip recession, and through the great recession, and still met my goals earlier than expected.”
The investors who held through the 2008 crash recovered fully by 2013. Those who sold in March 2009 (at the bottom) locked in losses and often missed the 330% bull market that followed.
For a 15-year investor, a 40% market drawdown is a buying opportunity, not a crisis – provided your emergency fund is intact and your investment timeline is genuine. An emergency fund (3–6 months of expenses in liquid savings) is the infrastructure that makes staying the course possible. Without it, a job loss forces you to sell investments at exactly the wrong moment.
5 Mistakes That Derail 15-Year Plans
From r/investing’s “what would you do differently” thread (510+ comments) and Bogleheads retrospective discussions, these are the regrets that come up most consistently:
- Starting too late. The single most common regret. There is no optimal time to start investing – only the time you actually start. Waiting for “things to settle down” is a 15-year regret waiting to happen.
- Timing the market. Investors who “got out” before the 2020 COVID crash and waited for “the real bottom” missed a 60%+ rally in six months. The professionals can’t time the market reliably. You can’t either, and trying is expensive.
- Paying high fees without realizing it. Most investors in bank-managed accounts or robo-advisors don’t know their all-in fee. It’s worth checking. A 1% AUM fee on $300,000 is $3,000/year – enough to fund half a Roth IRA contribution.
- Panic-selling during downturns. This is how investors turn a paper loss into a real one. If your asset allocation is correct, volatility is expected; riding it out is the whole strategy.
- Not maximizing tax-advantaged space first. Investing in a taxable account while leaving Roth IRA or 401(k) contributions on the table is leaving tax-free growth behind. Max the sheltered accounts before adding taxable investments.
Rebalancing: The Annual Maintenance That Matters
Markets don’t move uniformly. After a bull run, your 80/20 stock/bond allocation might drift to 88/12. That’s fine, but left unchecked for years, it means you’re carrying more risk than you intended – and you’ll feel that risk acutely in the next downturn.
Annual rebalancing restores your target allocation. The practical mechanics:
- Rebalance inside tax-advantaged accounts first (no capital gains tax triggered)
- In taxable accounts, use new contributions to rebalance rather than selling – each sale is a taxable event
- Per Schwab’s guidance: check once a year, and rebalance if any allocation has drifted more than 5 percentage points from target
This is genuinely a 30-minute-per-year task if you’re using a three-fund portfolio. Target-date fund holders don’t need to do it at all – it’s done automatically.
Putting It All Together: Your 15-Year Action Plan
Here’s the full framework in one place:
- Build a 3–6 month emergency fund first. This is not optional – it’s the infrastructure that keeps you invested through downturns.
- Contribute to your 401(k) up to the employer match. Capture 100% of it.
- Open a Roth IRA and max it ($7,000/year in 2026). Invest in a three-fund portfolio or target-date fund.
- Return to your 401(k) and contribute up to the $23,500 IRS limit.
- If you have money left, open a taxable brokerage account and invest in tax-efficient index ETFs.
- Automate everything. Set contributions on payday so you never make active decisions about whether to invest this month.
- Review your allocation once a year. Rebalance if needed. Otherwise, don’t touch it.
- Do not sell during downturns. The data is clear: staying the course beats every alternative.
Frequently Asked Questions
What is the best investment strategy for a 15-year timeline?
For most investors with a 15-year horizon, the optimal strategy is a low-cost index fund portfolio with roughly 80–95% in equities (US and international) and the remainder in bonds. Use tax-advantaged accounts (401(k) and Roth IRA) first, automate monthly contributions, and minimize fees. The three-fund portfolio – US total market + international + bond index funds – is the community consensus among experienced long-term investors.
How much should I invest per month to reach my goal in 15 years?
At a 10% average annual return (S&P 500 historical average since 1957), you’d need approximately $500/month to accumulate ~$205,000, $1,000/month for ~$414,000, and $2,000/month for ~$828,000. Use these as rough targets and adjust based on your specific goal. Remember that higher contributions and consistent monthly investing compound significantly over 15 years.
Is a 15-year investment horizon long enough to recover from a major crash?
Yes. Every major market crash in recorded history – including the 2000 dot-com bust, the 2008 financial crisis, and the 2020 COVID crash – recovered within 5–7 years. A 15-year investor who held through any of these downturns not only recovered but ended up significantly ahead. The risk of a 15-year horizon isn’t volatility; it’s selling during volatility.
What percentage of stocks vs. bonds is right for a 15-year investor?
According to Schwab’s official allocation models, an aggressive investor with 15+ years should hold 95% stocks and 5% cash. A moderate investor might hold 60% stocks / 35% bonds / 5% cash. The Bogleheads community consensus is 80–95% stocks for any investor with 15+ years remaining. The traditional “age in bonds” rule systematically underestimates the growth that long-horizon investors need.
Should I use a financial advisor for my 15-year investment plan?
Most investors with a 15-year horizon don’t need a traditional fee-based financial advisor. A three-fund portfolio in low-cost index funds at Vanguard, Fidelity, or Schwab can be set up in an afternoon and requires only annual rebalancing. A 1% AUM advisor fee costs 20% of your total returns over a long time horizon. If you need help with tax strategy, estate planning, or navigating a complex financial situation, a fee-only fiduciary planner (who charges a flat fee rather than a percentage of assets) is worth consulting. But for the investing itself, the index fund approach is well-documented and accessible.
The Bottom Line
The best 15-year investment plan isn’t complex. It’s a Roth IRA or 401(k) with a three-fund portfolio, automated contributions, and the discipline to leave it alone when markets get scary. The biggest risk isn’t choosing between VTSAX and VTI. It’s starting too late, paying too much in fees, or selling in a crash.
Fifteen years is enough time for a disciplined investor to build meaningful wealth. The S&P 500 has never failed to deliver over a 20-year horizon. The 15-year record is nearly as consistent. That’s not a guarantee – markets are uncertain – but it’s the best probabilistic bet available to ordinary investors.
Start now. Automate it. Lower your fees. Stay the course.