1. Introduction
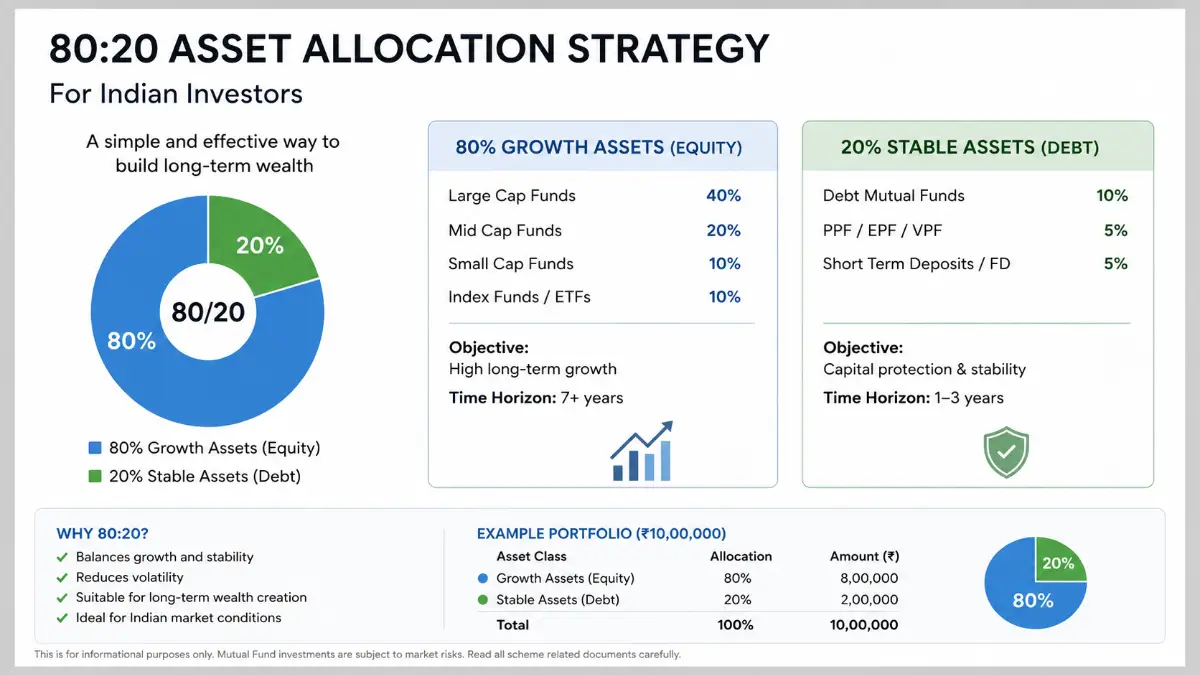
80:20 asset allocation means putting 80% of your portfolio into growth assets like equity and equity mutual funds, and keeping 20% in stability assets like debt funds, gold, or fixed deposits.
Per the NSE Nifty 50 Whitepaper (March 2026), the index’s 20-year CAGR stands near 11%-12.5%, while bank FDs have averaged only 6.5%-7% over the same period.
This gap is exactly why the 80:20 model exists — it lets you ride equity compounding while a 20% buffer absorbs shocks during corrections.
This model suits investors with a 15-20+ year horizon, typically those under 40, targeting 2032 goals like retirement corpus building, children’s education, or wealth creation beyond inflation.
2. Market Overview: Where Things Stand in 2026
FY26 was unusually rough. The Nifty 50’s 20-year rolling CAGR briefly dipped below 10% — only the second time in the index’s 30-year history — as FPIs pulled a record $12.58 billion in March 2026 alone.
The rupee slid from roughly ₹83/USD in early FY25 to ₹95/USD by end-FY26, adding pressure on foreign investors and equity valuations alike.
Despite the noise, retail conviction held firm: SIP inflows touched ₹31,781 crore in June 2026, and total mutual fund industry AUM reached ₹82.22 lakh crore, with SIP assets alone near ₹17 lakh crore (20.6% of total AUM).
This divergence — weak index CAGR alongside record SIP participation — is exactly the backdrop where disciplined allocation models like 80:20 matter most.
| Metric | 2026 Data Point |
|---|---|
| Nifty 50 20-year CAGR | 11%-12.5% |
| FD average return | 6.5%-7% |
| Gold 20-year CAGR range | 11%-14% |
| PPF rate (Apr-Jun 2026 qtr) | 7.1% |
| Mutual fund industry AUM | ₹82.22 lakh crore |
| SIP AUM share of total | ~20.6% |
3. Key Data Insights
Rupee-cost-averaged SIP returns in Nifty 50 have historically run closer to 12.8% over 20-year rolling windows, higher than pure lumpsum CAGR, because of monthly averaging through volatility.
Equity mutual fund inflows hit ₹40,450 crore in March 2026 alone, with flexi-cap funds leading for eight straight months — a signal that active diversification inside the equity sleeve is now standard practice.
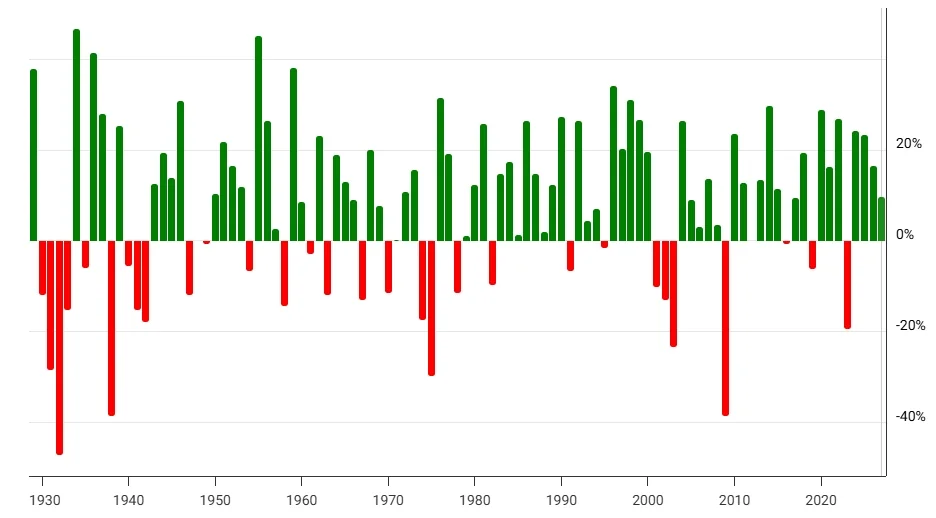
Standard deviation of Nifty returns falls from 35.3% at the 1-year horizon to just 1.1% at the 30-year horizon, proving that time in the market shrinks risk far more than timing it.
| Asset Class | 20-Yr CAGR | Volatility |
|---|---|---|
| Nifty 50 Equity | 11%-12.5% | High |
| Gold | 11%-14% | Moderate |
| Debt Funds/FD | 6.5%-7% | Low |
| PPF | 7.1% (current) | Very Low |
4. Investment Strategy: Building Your 80:20 Portfolio
Split the 80% equity sleeve across large-cap (40%), flexi-cap (25%), and mid/small-cap (15%) for balanced growth without excess concentration risk.
Within the 20% stability sleeve, a practical mix is debt funds (12%) and gold (8%), since gold has often moved inversely to equity during FPI-outflow phases like March 2026.
Rebalance annually — if equity grows to 85% after a rally, book profits back to the 80:20 line to lock gains and control drawdown risk.
| Component | Allocation |
|---|---|
| Large-Cap Equity Funds | 40% |
| Flexi-Cap Equity Funds | 25% |
| Mid/Small-Cap Equity Funds | 15% |
| Debt Funds | 12% |
| Gold (SGB/Gold ETF) | 8% |
5. Growth Forecast: 2027-2032 Projections
Most long-term Indian financial models still use a 10%-12% conservative CAGR assumption for Nifty 50 through 2032, grounded in structural GDP growth and rising corporate earnings.
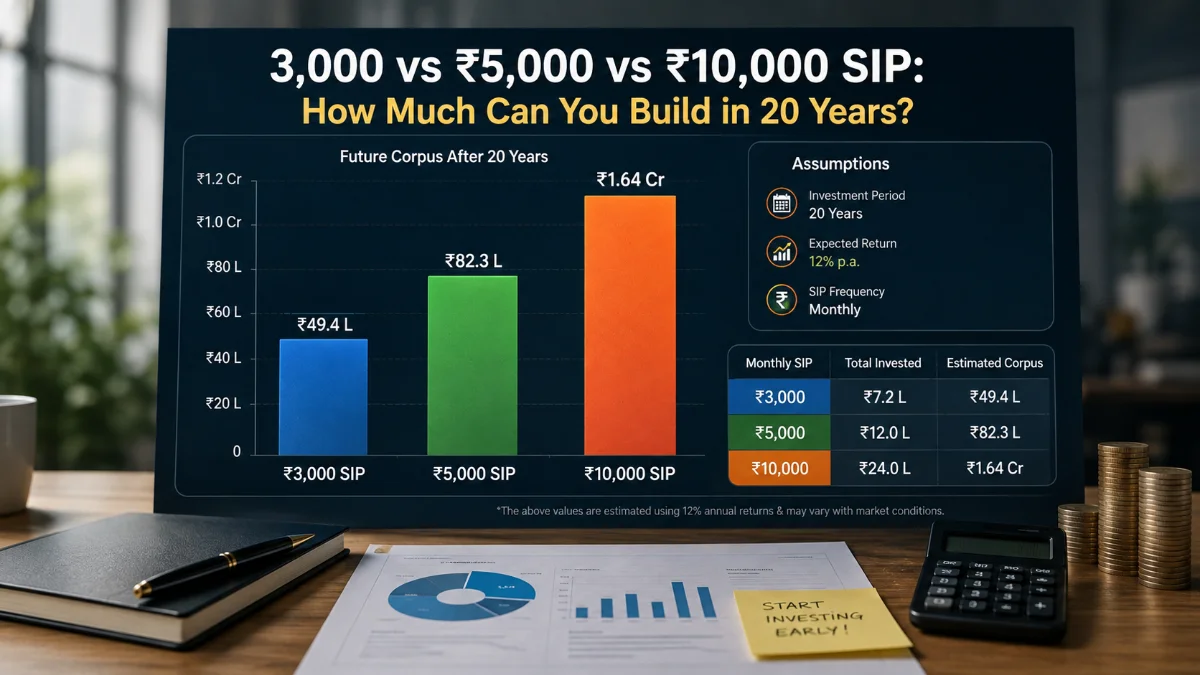
Assuming this range, a ₹15,000/month SIP in an 80:20 model could realistically compound faster than pure debt instruments but with materially lower volatility than a 100% equity book.
These are illustrative projections only, not guaranteed returns — actual outcomes will depend on market cycles, inflation, and global rate paths through 2032.
| Allocation Model | Assumed CAGR | Approx. 6-Yr Corpus (2026-2032) |
|---|---|---|
| 100% Equity | 12% | ₹15.8 lakh |
| 80:20 Equity-Debt | 10.6% | ₹15.1 lakh |
| 60:40 Equity-Debt | 9.2% | ₹14.4 lakh |
| 100% Debt/FD | 7% | ₹13.3 lakh |
| Sector | Projected 5-Yr CAGR Range |
|---|---|
| Banking & Financials | 11%-13% |
| IT & Digital Services | 9%-12% |
| Manufacturing/Capex | 12%-15% |
| Renewable Energy | 14%-18% |
| FMCG/Consumption | 8%-11% |
6. Risk Analysis
The March 2026 correction saw Nifty fall roughly 15% in a single quarter, showing how quickly a 100% equity portfolio can drop versus an 80:20 mix cushioned by debt and gold.
Historically, Nifty’s worst drawdown was -55.12% during the 2008 crisis; an 80:20 investor would have absorbed only about 80% of that shock, roughly a -44% portfolio hit instead.
Concentration risk also matters: small-cap funds carry thinner liquidity, so capping them at 15% of the equity sleeve limits single-category drawdown exposure.
| Allocation | Expected Volatility | Max Historical Drawdown | Suitability |
|---|---|---|---|
| 100:0 | Very High | ~55% | Age <30, 20+ yr horizon |
| 80:20 | High | ~44% | Age 30-45, 15+ yr horizon |
| 60:40 | Moderate | ~33% | Age 45-55 |
| 40:60 | Low | ~22% | Near-retirement |
7. Conclusion
The 80:20 asset allocation model works best for investors with long horizons who can tolerate short-term drawdowns of 40%+ in exchange for structurally higher compounding through 2032.
With SIP inflows crossing ₹31,000 crore monthly and industry AUM above ₹82 lakh crore in 2026, disciplined systematic investing remains the most practical way to execute this strategy.
Review your allocation annually, rebalance when equity drifts more than 5 percentage points from target, and always size your 20% buffer to match your actual liquidity needs, not just a rule of thumb.
Frequently Asked Questions
Q1. Is 80:20 asset allocation good for beginners?
It suits beginners with a 15+ year horizon and stable income, but first-time investors should start with a lower equity share like 60:40 and increase exposure gradually.
Q2. What is the difference between 80:20 and 60:40 allocation?
80:20 prioritizes growth with higher volatility, while 60:40 trades some return potential for a smoother ride — the 6-year illustrative gap is roughly ₹70,000-₹1 lakh on a ₹15,000/month SIP.
Q3. How often should I rebalance an 80:20 portfolio?
Annually is standard practice, or whenever equity allocation drifts more than 5 percentage points from the 80% target due to market movement.
Q4. Can I use gold instead of debt for the 20% portion?
Yes — many investors split the 20% between debt (12%) and gold (8%), since gold has shown a 11%-14% CAGR and often moves inversely to equity during FPI outflow phases.
Q5. Is 80:20 allocation suitable for retirement planning?
It works well 15-20 years before retirement, but should shift toward 40:60 or more conservative debt-heavy models within 5 years of the goal date.
SEBI Disclaimer: Mutual fund investments are subject to market risks. Please read all scheme-related documents carefully before investing. Past performance may or may not be sustained in the future. This article is for educational purposes only and does not constitute investment advice. Consult a SEBI-registered investment adviser before making financial decisions.