
1. The Renaissance of Gold in a Digital Age
As of 2025, the global financial landscape is undergoing a structural realignment. Gold, the world’s oldest store of value, is experiencing a profound “Renaissance,” transitioning from a mere commodity to a critical quasi-currency in a fragmenting monetary order. For the modern investor, gold serves as the ultimate hedge against the weaponization of traditional fiat systems.
The primary drivers of this resurgence are:
- De-dollarization: The U.S. Dollar’s share of global reserves has slipped below 47%, as Southeast Asian and BRICS nations formalize local-currency trade-settlement schemes to avoid currency volatility and “geopolitical haircuts.”
- Central Bank Accumulation: In the first quarter of 2025 alone, central banks purchased over 244 metric tons of gold—well above the five-year quarterly average—accounting for nearly one-quarter of total annual gold inflows.
- Geopolitical Risk: The 2022 seizure of Russian currency reserves acted as a catalyst, proving that tangible assets are the only “neutral” reserve.
While these drivers signal a secular bull market, they also introduce extreme volatility. Human cognitive biases are ill-equipped to process these high-dimensional, non-Euclidean relationships, necessitating the move toward demanding, AI-driven forecasting tools.
2. From Intuition to Algorithms: Why Machine Learning?
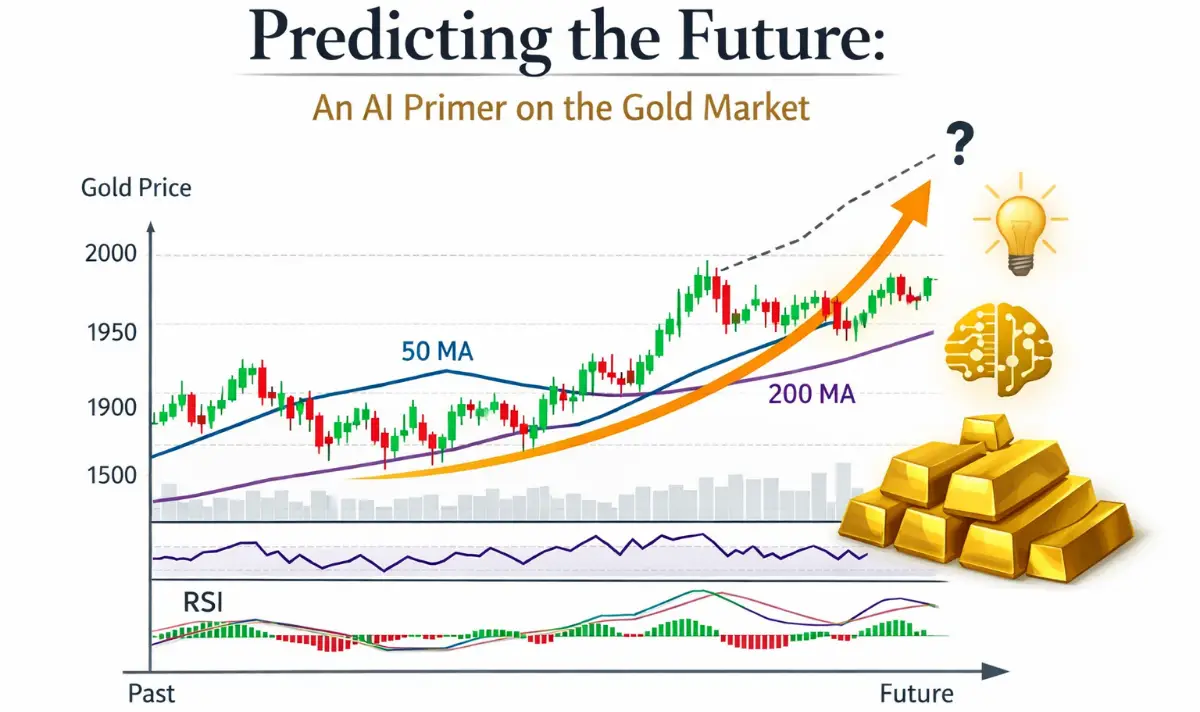
Traditional technical analysis relies on manual candlestick patterns and static indicators like moving averages. While these methods can identify linear trends, they fail to account for the nonlinear relationships where a single macroeconomic shift (like a GDP print) can have a disproportionate, non-proportional impact on price.
Machine Learning (ML) allows for multimodal data integration, processing technical, fundamental, and sentiment data simultaneously to identify hidden correlations across high-dimensional datasets that are too complex for manual calculation.
Traditional Analysis vs. Machine Learning Analysis
| Feature | Traditional Technical Analysis | Machine Learning (ML) Analysis |
| Data Scope | Restricted to price and volume history. | Fuses technical, macroeconomic, and sentiment data. |
| Complexity | Linear; looks for “if-then” patterns. | Nonlinear; identifies deep, multi-layered trends. |
| Processing | Manual inspection; prone to bias. | High-dimensional processing of thousands of signals. |
| Adaptability | Relies on static, lagging indicators. | Self-optimizing; performs hyperparameter tuning over time. |
To navigate the “memory” required for these markets, we employ a specialized neural architecture: the Long Short-Term Memory (LSTM) network.
3. The Mechanics of Memory: Understanding LSTM Networks
Standard Recurrent Neural Networks (RNNs) suffer from the “vanishing gradient” problem. During training, as the model looks further back in time, mathematical gradients shrink exponentially toward zero, causing the network to “forget” the significance of early data. LSTM networks solve this via “memory cells” that retain information across more than 1,000 discrete-time lags.
Think of an LSTM as an intelligent vault with Three Gates that manage the gold market’s complex history:
- The Forget Gate (“The Filter”): This gate discards “noise” that no longer impacts current volatility—such as the price echo of a 2015 flash crash that has been superseded by new market regimes.
- The Input Gate (“The Vault”): This determines which new, high-impact data is worth preserving for long-term forecasting, such as the structural shift caused by the 2022 Russian reserve seizure.
- The Output Gate (“The Messenger”): This gate selects the specific “memories” (e.g., historical correlations between gold and a 10% DXY decline) to generate the current price prediction.
This architecture ensures the model maintains a persistent “memory” of long-term cycles while remaining sensitive to daily price action.
4. Building the Blueprint: The Hybrid LSTM-MLP Architecture
Following the University of Tehran’s research, we utilize a “fusion” approach. A single network is insufficient for the gold market’s dual identity, so we deploy a Hybrid LSTM-MLP Architecture that separates technical “fast” data from fundamental “slow” data.
- The Daily LSTM (Technical Subnetwork): Learns short-term momentum.
- Inputs: Daily Gold Prices (High, Low, Close), Oil Prices, Dow Jones Index, DXY (Dollar Index), and Trading Volume.
- The Monthly LSTM (Fundamental Subnetwork): Learns long-term structural trends.
- Inputs: Macroeconomic indicators including GDP, CPI, PPI, Inflation, and Unemployment rates.
The Decision Maker: Multilayer Perceptron (MLP)
The outputs from these parallel LSTMs feed into a Multilayer Perceptron (MLP). This network acts as the “Decision Maker,” performing the final fusion of technical signals and macroeconomic fundamentals to produce daily price predictions for the High, Low, and Close.
5. Optimization: The Gray Wolf Optimizer (GWO)
To move beyond “black box” modeling, we use the Gray Wolf Optimizer (GWO) for hyperparameter optimization. The GWO mimics the hunting hierarchy of a wolf pack to search for the “optimal configuration”—specifically, the number of internal neurons in each layer that results in the lowest Root Mean Square Error (RMSE).
Optimal Neuron Configurations (GWO Findings)
| Network | High Price Subnetwork | Close Price Subnetwork | Low Price Subnetwork |
| Daily LSTM | 673–851–810 | 90–36–69 | 53–343–97 |
| Monthly LSTM | 713–289–533 | 441–581–671 | 386–461–381 |
| Final MLP | 479–440–393 | 317–327–362 | 105–275–319 |
By automating this search, the GWO ensures the model is neither “underfitting” the complexity of the market nor “overfitting” on random noise.
6. The Scorecard: Measuring Predictive Accuracy and Error
We evaluate model performance using two critical metrics: Mean Absolute Error (MAE) and Root Mean Square Error (RMSE).
- MAE is linear; every dollar of error is weighted equally, providing an intuitive “average miss” ($0.21 in this model).
- RMSE is quadratic; it penalizes large outliers more heavily. For a quantitative lead, minimizing RMSE is critical because it prevents “tail-risk” events—those massive, outlier misses that can clear a trading account.
Performance Comparison (Daily Forecasts)
| Model Type | Mean Absolute Error (MAE) |
| BPNN (Classical Neural Network) | $9.82 |
| FNN (Feedforward Network) | $8.97 |
| IEMD–BPNN–PMR (Advanced Hybrid) | $2.17 |
| Proposed LSTM–MLP Model | $0.21 |
The $0.21 MAE for the daily close represents the “gold standard” of precision, effectively placing the AI’s “guess” within cents of the actual market settlement.
7. From Prediction to Profit: Trading Strategies and Scenarios
Accuracy is only useful if it is actionable. In live market demos, the AI’s High, Low, and Close forecasts were used to set “Pending Orders” in MetaTrader. By targeting the predicted levels and setting stop-losses at one-third of the target distance, the model enforced a disciplined 3:1 Reward-to-Risk ratio.
Live Market Performance: Using a 1:100 leverage framework on a demo account, this AI-driven strategy achieved a 171% to 173% return over a three-month period.
2025–2030 Expert Price Scenarios
To provide a long-term “so what,” we synthesized the SUSS scenarios with broader institutional targets from Goldman Sachs and JP Morgan.
- Base Case (50% Prob): Gold reaches $4,200 by Q4 2026 (Moderate growth/gradual cuts).
- Bull Case (25% Prob): Gold surges to 5,200** by Q4 2026. Note: **Goldman Sachs** maintains a high-conviction target of **4,900 by Dec 2026.
- Bear Case (15% Prob): Gold corrects to $2,800 by Q4 2026 (Rapid recovery/strong USD).
- Extreme Bull (10% Prob): Gold hits 8,000** by Q4 2026. In the medium-long term, **JP Morgan** forecasts a target of **6,000 by 2029.
8. Strategic Implementation: Gold IRAs and ETFs
Transitioning from AI theory to wealth protection involves choosing between physical and digital ownership.
- Gold IRAs: These allow you to hold physical bullion coins or bars (e.g., American Eagles, Canadian Maple Leafs) within a tax-advantaged account. These must be held by an IRS-approved custodian in a secure depository, offering zero counterparty risk.
- ETFs (GLD, IAU): These funds track the spot price and offer high liquidity for tactical trading, though they do not grant ownership of physical metal.
Recommended Allocations by Investor Profile
- Conservative (5–8%): Focus on capital preservation through physical bullion and IRAs.
- Moderate (10–15%): A balanced mix of physical gold, ETFs, and major mining stocks.
- Aggressive (15–20%): High exposure to mining stocks and tactical AI-driven trading.
In this “New Golden Era,” the intersection of ancient precious metals and cutting-edge neural networks provides a definitive framework for protecting and growing wealth in an increasingly uncertain global economy.


1 thought on “Predicting the Future: An AI Primer on the Gold Market”