

1. The Strategic Vision for 2026: Navigating Market Maturity
As we enter the 2026 fiscal year, the Indian capital markets have reached a state of maturity that necessitates a fundamental shift in capital allocation frameworks. We are transitioning from an era of speculative, high-velocity growth toward a disciplined, cost-optimized strategy focused on risk-adjusted benchmarks and wealth preservation. In this environment, the “easy alpha” of the past is superseded by the need for institutional-grade structural design.
Table of Contents
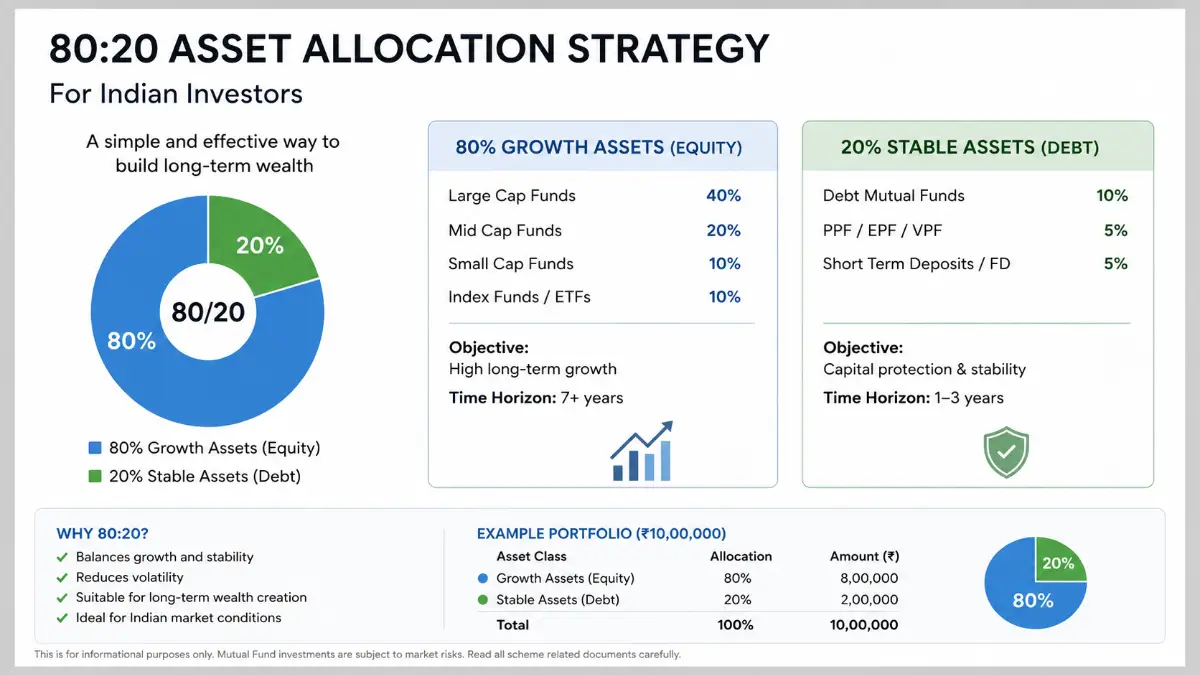
The 2026 strategy is anchored by three institutional pillars: a Passive Large-Cap dominance to capture core market earnings with minimal leakage; a Mid-Cap alpha engine requiring a strict 7-year investment horizon to harvest cyclical growth; and Tactical Liquidity reserves to maintain “dry powder” for market dislocations. This document provides the rigorous mathematical roadmap required to institutionalize retail portfolios, ensuring that every basis point of cost is leveraged for maximum long-term compounding.
2. The Cost-Performance Paradox: Impact of Expense Ratios on Net Returns
In a mature market, cost management is the only guaranteed “alpha.” Every percentage point lost to an expense ratio is a permanent reduction in the compounding power of the portfolio. This “leakage” is not merely an administrative detail; it is a critical determinant of terminal wealth. For institutional-grade portfolios, the expense ratio is the primary hurdle that active management must overcome to justify its existence.
Data from the JETIR study (2019–2023) demonstrates a clear, statistically significant inverse correlation between expense ratios and NAV growth in the Indian large-cap segment.
| Fund Name | Correlation (Expense Ratio vs. NAV Growth) |
| SBI Bluechip Fund | -0.97 |
| ICICI Prudential Bluechip Fund | -0.95 |
| Nippon India Multicap Fund | -0.88 |
| Aditya Birla Sun Life Frontline Equity Fund | -0.86 |
| HDFC Top 100 Fund | -0.85 |
| Quant Infrastructure Fund | -0.59 |
| Franklin India Bluechip Fund | -0.55 |
| Axis Bluechip Fund | -0.54 |
| UTI Equity Savings Fund | -0.48 |
| Tata Equity PE Fund | +0.67 |
The data confirms that for 90% of the funds analyzed, lower expenses are statistically tied to superior performance. Notably, the SBI Bluechip Fund displays the strongest inverse correlation at -0.97. However, a strategist must note the anomaly of the Tata Equity PE Fund (+0.67); here, a specific value-oriented strategy managed to buck the trend, showing that while cost efficiency is the general rule, high-conviction value strategies can occasionally deliver returns that justify their overhead. Nevertheless, for the core of the portfolio, minimizing leakage through passive indexing remains the most statistically sound path to outperformance.
3. Institutionalizing the Core: The Pivot to Passive Large-Cap Vehicles
The post-2018 SEBI reclassification has effectively settled the active vs. passive debate for large-cap exposure. By mandating that large-cap funds invest 80% of assets in the top 100 stocks, regulators have turned active managers into “closet indexers.” Today, 75% of active large-cap funds fail to beat their benchmark.
To justify the higher fees of an active fund, the non-overlapping 40% allocation of the portfolio must work nearly 2.5 times harder than the index. Mathematically, this creates an “Alpha Hurdle” of 4.7%—meaning that specific 40% sleeve must generate massive outperformance just to cover the 1% fee differential and a modest 1% margin of victory.
For the 2026 core, we recommend the HDFC S&P BSE Sensex Index Plan. While the Nifty 50 is common, the Sensex (30 stocks) respects the principle that diversification benefits peak at 25–30 stocks. Adding the additional 20 stocks found in the Nifty 50 increases the capture of the top 500 profit pool by only 10% (from 44% to 54%) while expanding the portfolio size by 66%. This represents a clear diminishing marginal utility of diversification. Furthermore, we prioritize Index Funds over ETFs. While ETFs may tout expense ratios as low as 0.05%, they harbor hidden costs: Bid-Ask spreads (which can reach 2–5% on low-volume days) and “Authorized Participant” middlemen who profit from NAV variances. The HDFC S&P BSE Sensex Index Plan, with an expense ratio of 0.20%–0.30%, provides a transparent, low-cost vehicle free from these structural inefficiencies.
4. Harvesting Alpha: The Risk-Reward Balance in Mid-Cap Selection
Mid-caps are the primary engine of alpha in the 2026 portfolio architecture. Unlike the large-cap space, the mid-cap segment offers genuine opportunities for active managers to discover undervalued growth. However, this sleeve demands a 7-year horizon to navigate the volatility inherent in smaller market-cap tiers.
Top-tier performers identified by ETMutualFunds analysis include:
- Edelweiss Mid Cap Fund: A model of consistency with a 25.95% 3Y, 22.45% 5Y, and 22.56% 7Y CAGR.
- Motilal Oswal Midcap Fund: The category leader for the medium term, delivering a 24.59% 5-year CAGR.
To mitigate pure mid-cap volatility, we propose the Kotak Large & Mid Cap Fund as a balanced active solution. This fund is selected for its ability to capture alpha that is now restricted in the pure Large-Cap category. It satisfies our strict institutional filters: a 10-year track record, consistent outperformance of the Nifty 250 benchmark, and a direct plan expense ratio below the 0.66% category average. This “growth sleeve” ensures the portfolio captures the next generation of market leaders while maintaining a baseline of large-cap stability.
5. Tactical Reserves: Liquid Funds as the Modern Emergency Reserve
In 2026, liquidity must be treated as a strategic asset, not a neglected balance. Traditional savings accounts fail to provide the necessary discipline or tax efficiency. For a strategist, higher returns in a debt fund are a “red flag” indicating that a fund manager is chasing yield through credit risk. Chasing “debt alpha” is a fool’s errand for a liquidity reserve.
Liquid Funds provide superior tactical advantages:
- Tax Deferral Advantage: Tax is only triggered upon redemption, allowing for uninterrupted compounding, unlike Fixed Deposits (FDs) which are taxed annually.
- Portfolio Discipline: Structural separation from spending accounts prevents impulse withdrawals.
- Credit Quality Mandate: Institutional safety requires >90% AAA/Sovereign assets and a 91-day maturity cap.
We mandate the Quantum Liquid Fund for this reserve. It is chosen for its unique zero exposure to private corporate debt—a rare safety feature in the current market. By focusing on Treasury Bills (T-Bills) and PSU bank certificates with a 0.15% expense ratio, it prioritizes capital preservation over risky yield, functioning as a true “dry powder” reserve.
6. Portfolio Insurance: Strategic Allocation to Precious Metals
Strategic hedging through precious metals is mandatory to mitigate country-specific economic risks and currency devaluation. While gold has traditionally been the primary hedge, the 2026 architecture includes Silver ETFs, noting that silver has delivered a 62% XIRR since launch, significantly outpacing gold’s 42%.
Regarding vehicle selection, we distinguish between asset classes. While Index Funds are superior for equity, ETFs are superior for Gold and Silver. In precious metals, the underlying asset (bullion) does not suffer from the “Authorized Participant” spread issues and liquidity fragments to the same degree as equity baskets. Furthermore, using a “Fund of Funds” (FoF) for metals adds a “double layer” of management fees that erodes the hedge’s value.
We recommend the ICICI Prudential Gold ETF (or the ICICI Prudential Regular Gold Savings Fund—Direct Plan—for non-Demat holders). These vehicles offer the liquidity and minimal tracking error required to ensure the portfolio remains adequately insured against domestic volatility.
7. Performance Projections: ARIMA Forecasting (2026–2028)
Forward-looking data is essential for benchmarking the long-term viability of this strategy. Using ARIMA (AutoRegressive Integrated Moving Average) modeling, we project the NAV trajectories for key components of the 2026 architecture.
Forecasted NAV Growth for the 2026 Fiscal Year:
| Fund Name | 2026 Forecasted NAV (₹) |
| HDFC Top 100 Fund | 1,384.51 |
| Franklin India Bluechip Fund | 1,198.66 |
| Aditya Birla Sun Life Frontline Equity Fund | 631.09 |
| Nippon India Multicap Fund | 339.89 |
| SBI Bluechip Fund | 119.63 |
These projections provide an empirical “So What?” for the 2026 strategy. The funds with the highest negative correlations to cost—specifically the SBI Bluechip Fund and HDFC Top 100 Fund—are the same vehicles displaying the most robust ARIMA growth trajectories. This validates our core thesis: in a maturing market, cost-efficiency is the primary predictor of forward-looking NAV strength. The 2026 strategy is not built on market timing, but on the institutionalized wealth compounding achieved through mathematical rigor and absolute cost discipline.


1 thought on “Strategic Investment Review: 2026 Fiscal Year Portfolio Architecture”